Introduction
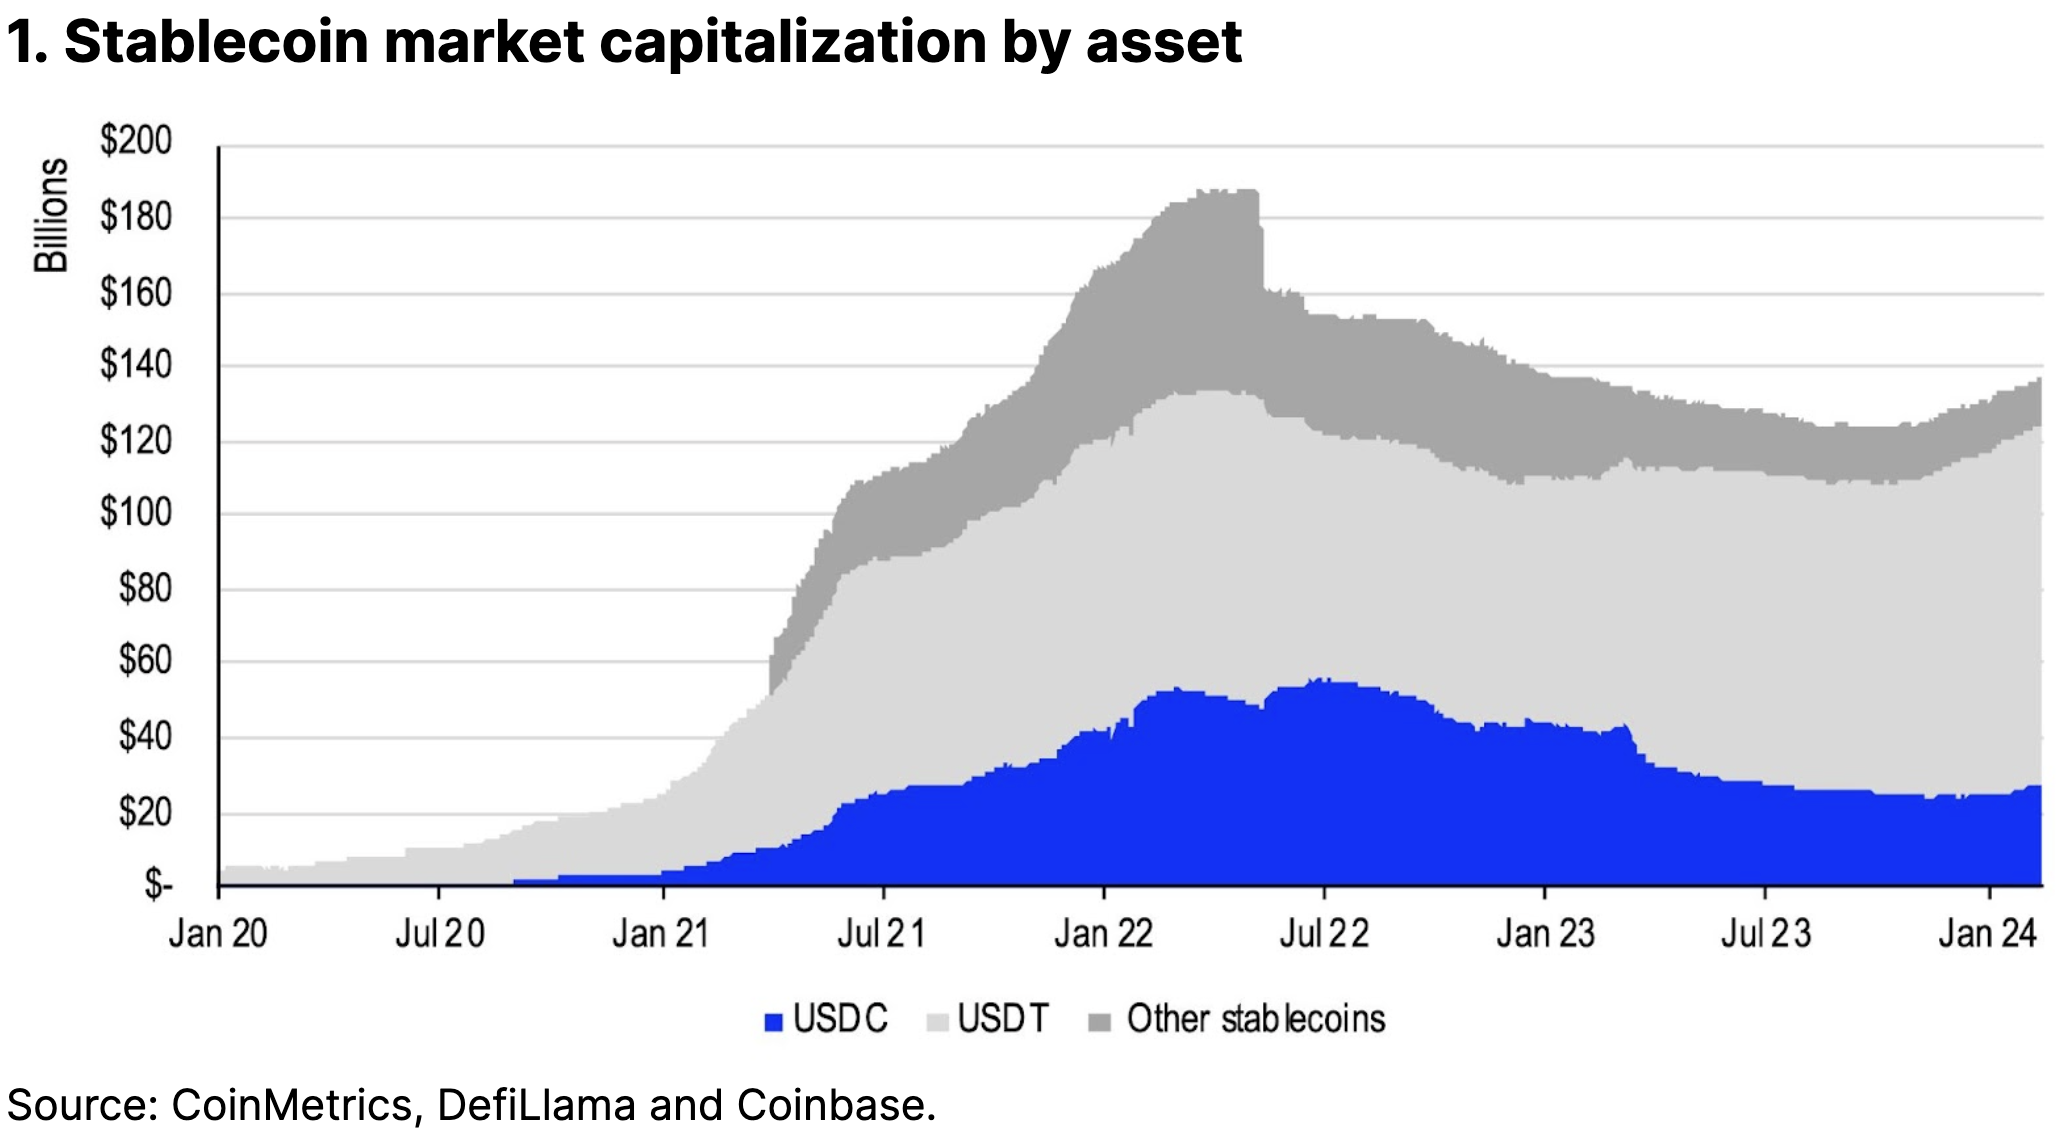
The stablecoin landscape changed materially in 2023, mainly due to some important exogenous shocks. These include tighter capital conditions due to Federal Reserve rate hikes, the fallout from the FTX bankruptcy in November 2022 and the US regional banking crisis in March 2023. But since early 4Q23, stablecoin market capitalization has begun to pick up sharply, boosted in large part by the rise in overall crypto demand. As a result, total stablecoins in circulation have climbed up to US$137B as of February 15, 2024, not far from the $138B at the start of last year.
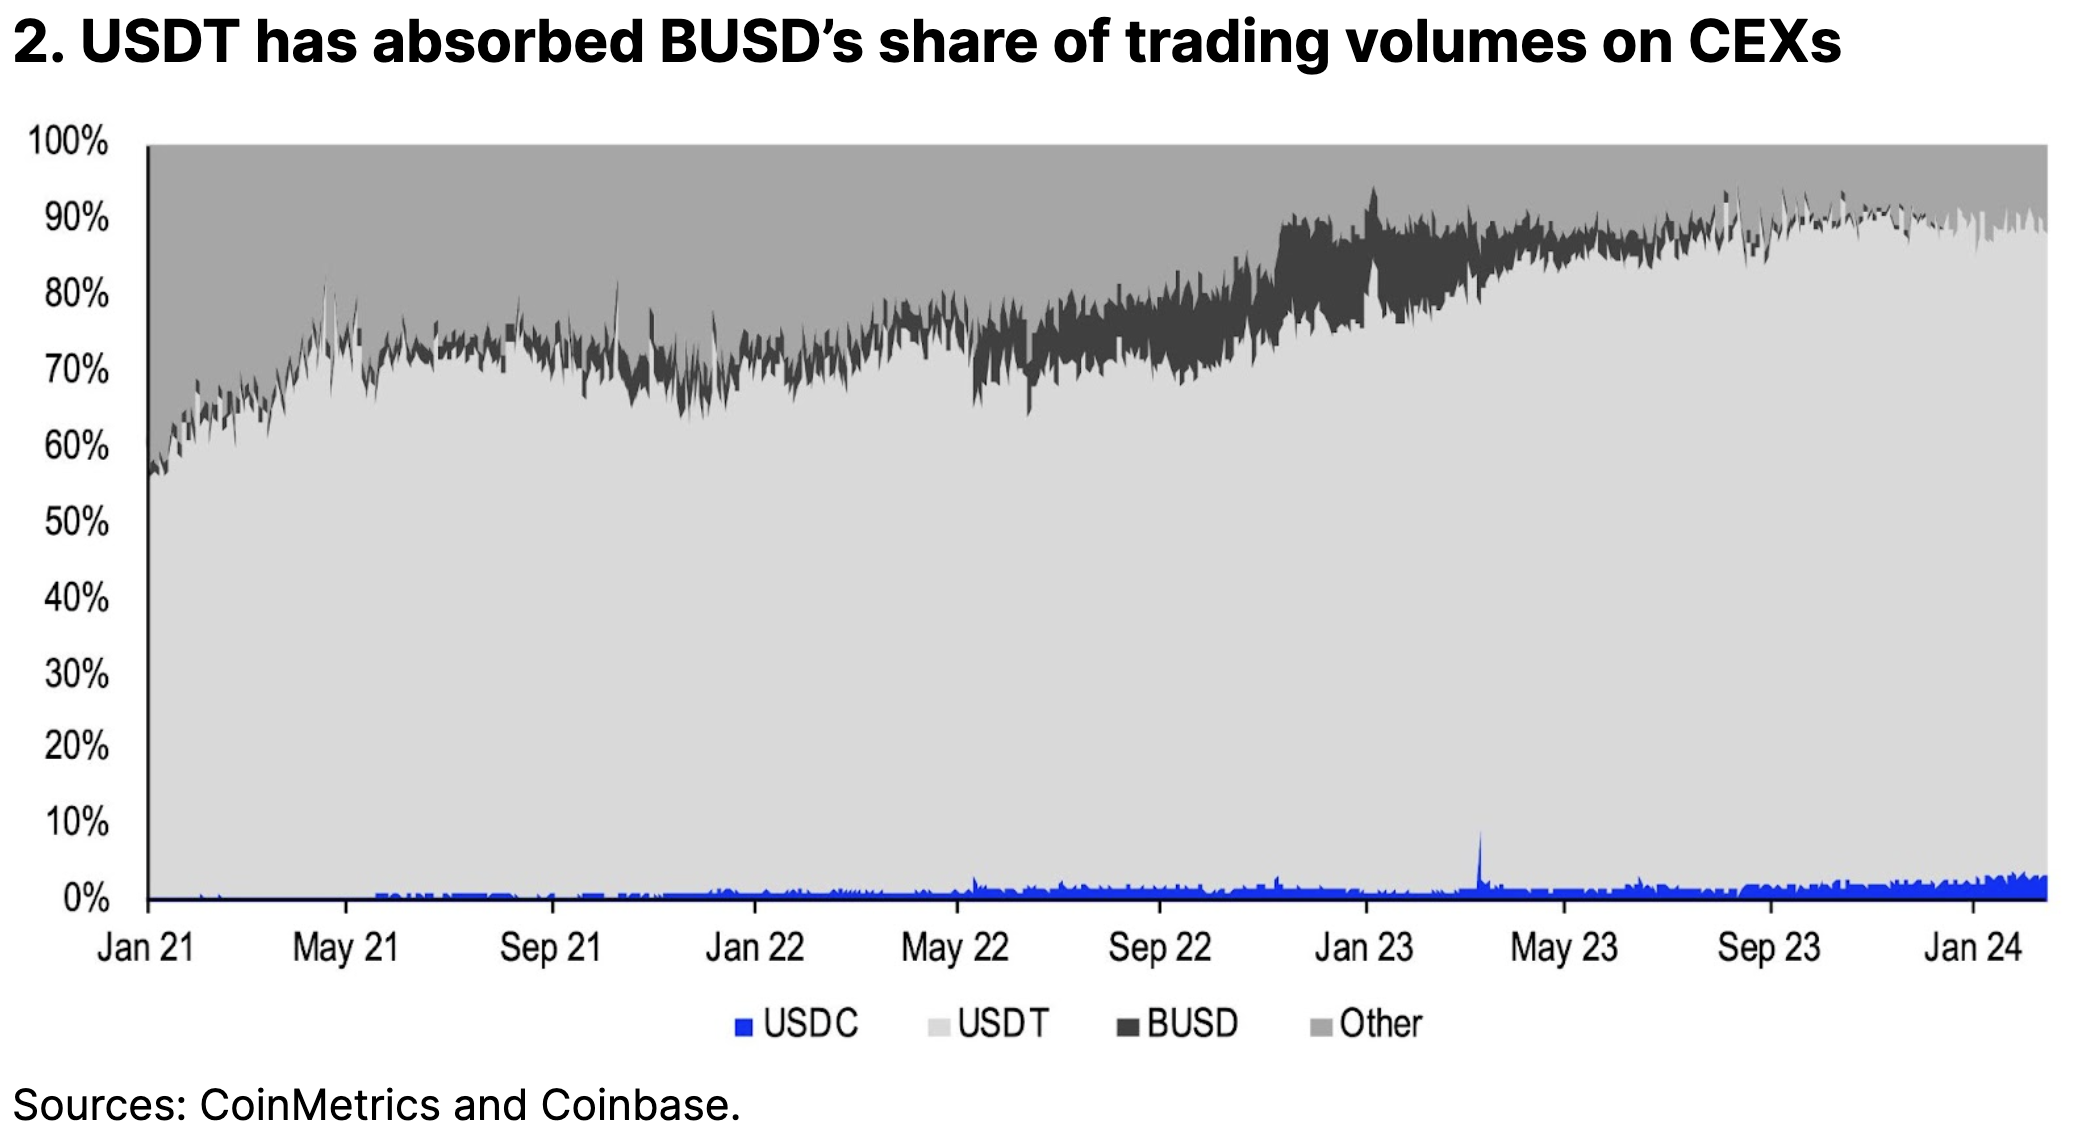
Notably, the supply of Circle’s USDC has finally started to grow again, up 14.3% or over $3.5B since December 1, 2023, taking its total market cap to $28B – after dropping in the first three quarters of last year. Comparatively, Tether’s USDT has increased by a smaller 8.7% to $97B over the same period, which nevertheless gives it the majority 71% share of the stablecoin market. USDT’s role in settling crypto derivatives like perpetual futures (which are almost exclusively traded outside of the US) partly explains the breadth of USDT’s reach. Indeed, around 83% of total centralized exchange volumes globally (both spot and futures) currently utilizes USDT as the base currency.
That’s starting to change, as USDC is gaining a greater presence in non-US markets. Since the start of 2023, USDC’s share of spot and derivatives activity has increased by almost 5x, albeit to a still low 4% of total CEX volumes globally. Besides US spot BTC ETFs, the recent acceleration has also had to do with the launch of Coinbase International Exchange and the relisting of USDC on Binance. Coinbase also started a market maker incentive program, which has improved the liquidity and market depth of USDC-related trading pairs in both spot and perps.
Struggle for dominance
Approximately $137B of stablecoins are currently in circulation, in line with the $138B at the start of 2023, signaling a recovery in the supply drop witnessed in the first three quarters of last year. That fall in the stablecoin market cap was partly indicative of the broader liquidity drain that affected all asset classes, as global central banks reduced their balance sheets and tightened interest rates. However, we think that a rise in regulatory crackdowns in the crypto industry (following the implosion of FTX in November 2022) may have also contributed to thinner liquidity for the overall ecosystem during much of 2023.
Liquidity in the crypto ecosystem tends to be reflected within stablecoin dynamics as many centralized and decentralized exchanges alike (CEXs and DEXs, respectively) price their assets in USD stablecoins. The resurgence in overall crypto liquidity and market depth late last year manifested in a higher stablecoin market cap. This reflects how demand for crypto has rebounded due to the anticipation and eventual launch of spot bitcoin ETFs in the US through late 2023 and early 2024.
Yet, despite the improvements in liquidity, stablecoin dominance of the total crypto market cap has remained near 7-9% since the end of November, half of the 16% peak levels observed in late 2022. That’s partly because stablecoin supply changes are also tightly coupled with trading volumes, and that activity has only recently started to recover in earnest. As a result, we’ve seen a 75% growth in the total crypto market cap (to about $2T) that has outpaced stablecoins since the start of 4Q23.
How did we get here?
The supply balance among stablecoins has also shifted in the last year. For example, Tether’s USDT saw its market cap grow from $66.2B in January 2023 to $97.1B as of mid-February 2024. As a result, USDT’s share of the stablecoin market has gone up from 49% to over 71% during that time.
At least half of this increase was driven primarily by the shutdown of BUSD (issued by Paxos for Binance), whose market capitalization dropped from more than $16B (in February 2023) to less than $100M by the start of 2024. That has helped USDT capture a greater share of the derivatives market at around 81% of the open interest in the perpetual futures market on CEXs, compared to only 72% prior to the delisting of BUSD. Note that perps make up three-quarters of all trading volumes across spot and futures, while term futures make up only 3% of activity.
Comparatively, the supply of Circle’s USDC dropped from over $44.2B to just over $25.0B in the first nine months of 2023, though we believe that this was the carryover of a preexisting trend from 2H22. Indeed, we think the curtailment in USDC supply really began when OFAC (the Office of Foreign Assets Control) sanctions targeted USDC addresses associated with Tornado Cash in early August 2022. This was followed by Binance’s decision to convert its users’ USDC to BUSD in late September 2022.
Separately, MakerDAO staged plans as early as October 2022 to reduce the USDC reserves in its peg stability module (PSM) that backs its overcollateralized, algorithmic stablecoin DAI. We believe those plans were accelerated after the US regional banking crisis in March 2023, which both led to a brief secondary market dislocation for USDC but also drew greater attention to the sharp rise in US interest rates. That event made it clear how attractive the yields in real world assets like US Treasury bills were, as MakerDAO converted much of its USDC collateral to T-bills – emulating a similar move by many retail investors at that time of buying money market funds.
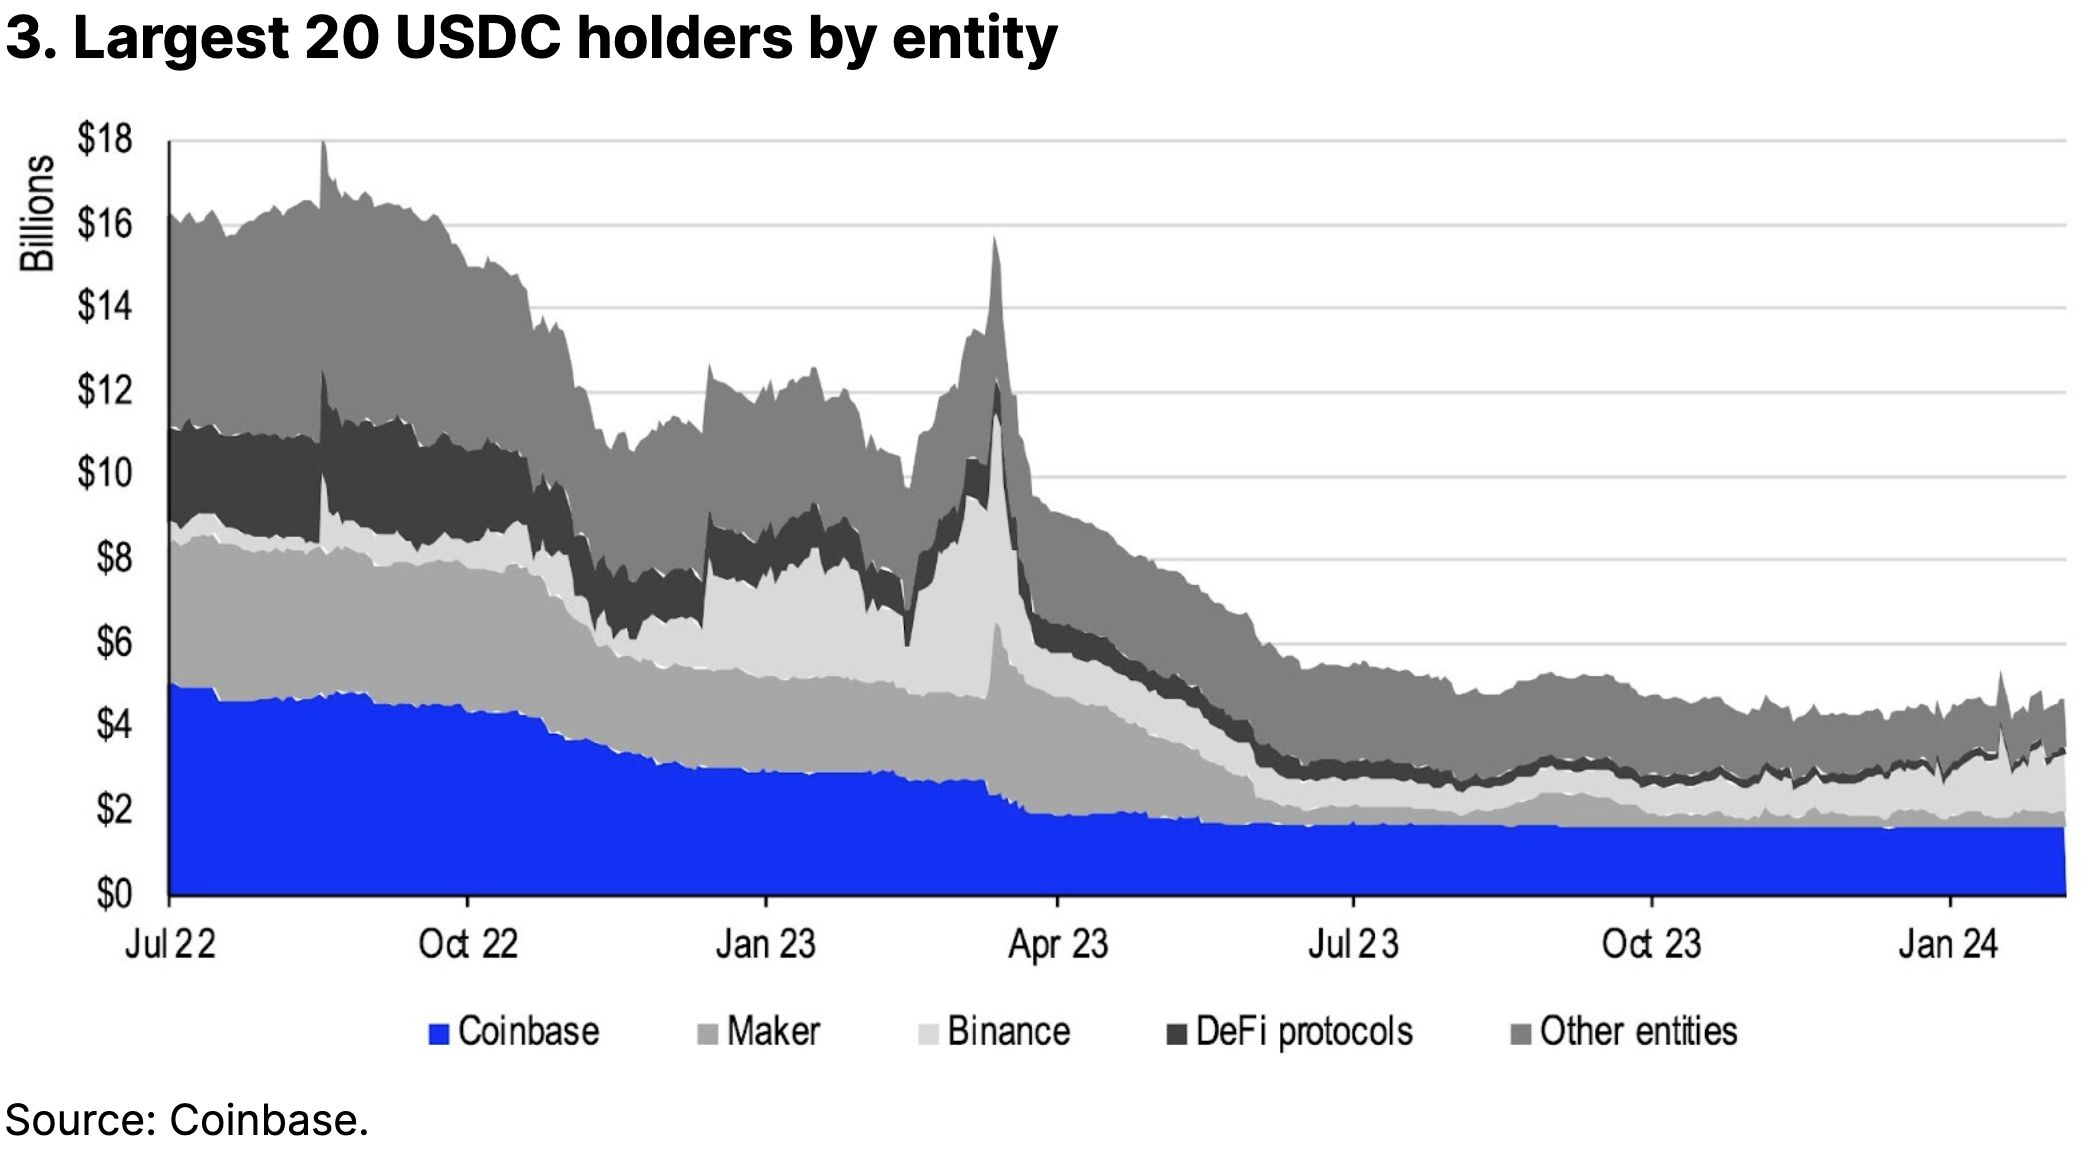
Consequently, that meant that two of the largest 20 holders of USDC by entity – Binance and Maker – reduced a net $4.7B position to only $968M between January and October 2023. Not only did that work against efforts by Coinbase to lower the barriers for international adoption of USDC, but it also had second-order effects on USDC holdings within decentralized finance (DeFi) protocols like Compound, Aave, Curve and Uniswap, which themselves had suffered from a decline in activity through most of 2023. Indeed, on Ethereum, stablecoin onchain volumes moderated in 2Q23 and 3Q23 to an average of $9B per day before later recovering to around $12-14B per day in 4Q23 and almost $20B in early 2024.
The trend is your friend
That makes the recent resurgence in USDC supply all the more notable. Since December 1, 2023, the market cap of USDC has increased by 14.3% (to $28.0B), outpacing the market cap growth of USDT, which expanded by a smaller 8.7% (to $97.1B).
In our view, the emerging trend is what’s important here, as we think it speaks to a broader geographic shift happening within the crypto trading environment, since the launch of US spot bitcoin ETFs. That is, according to a CoinMetrics study on the geographic dominance of stablecoins, published in August 2023, USDC has typically seen more usage in North America and Western Europe, whereas USDT has historically seen its highest trading volumes in Asia, Africa and Latin America. Indeed, USDT dominates most other regions due to its early adoption on many international exchanges, which has made it more ubiquitous in offshore crypto trading.
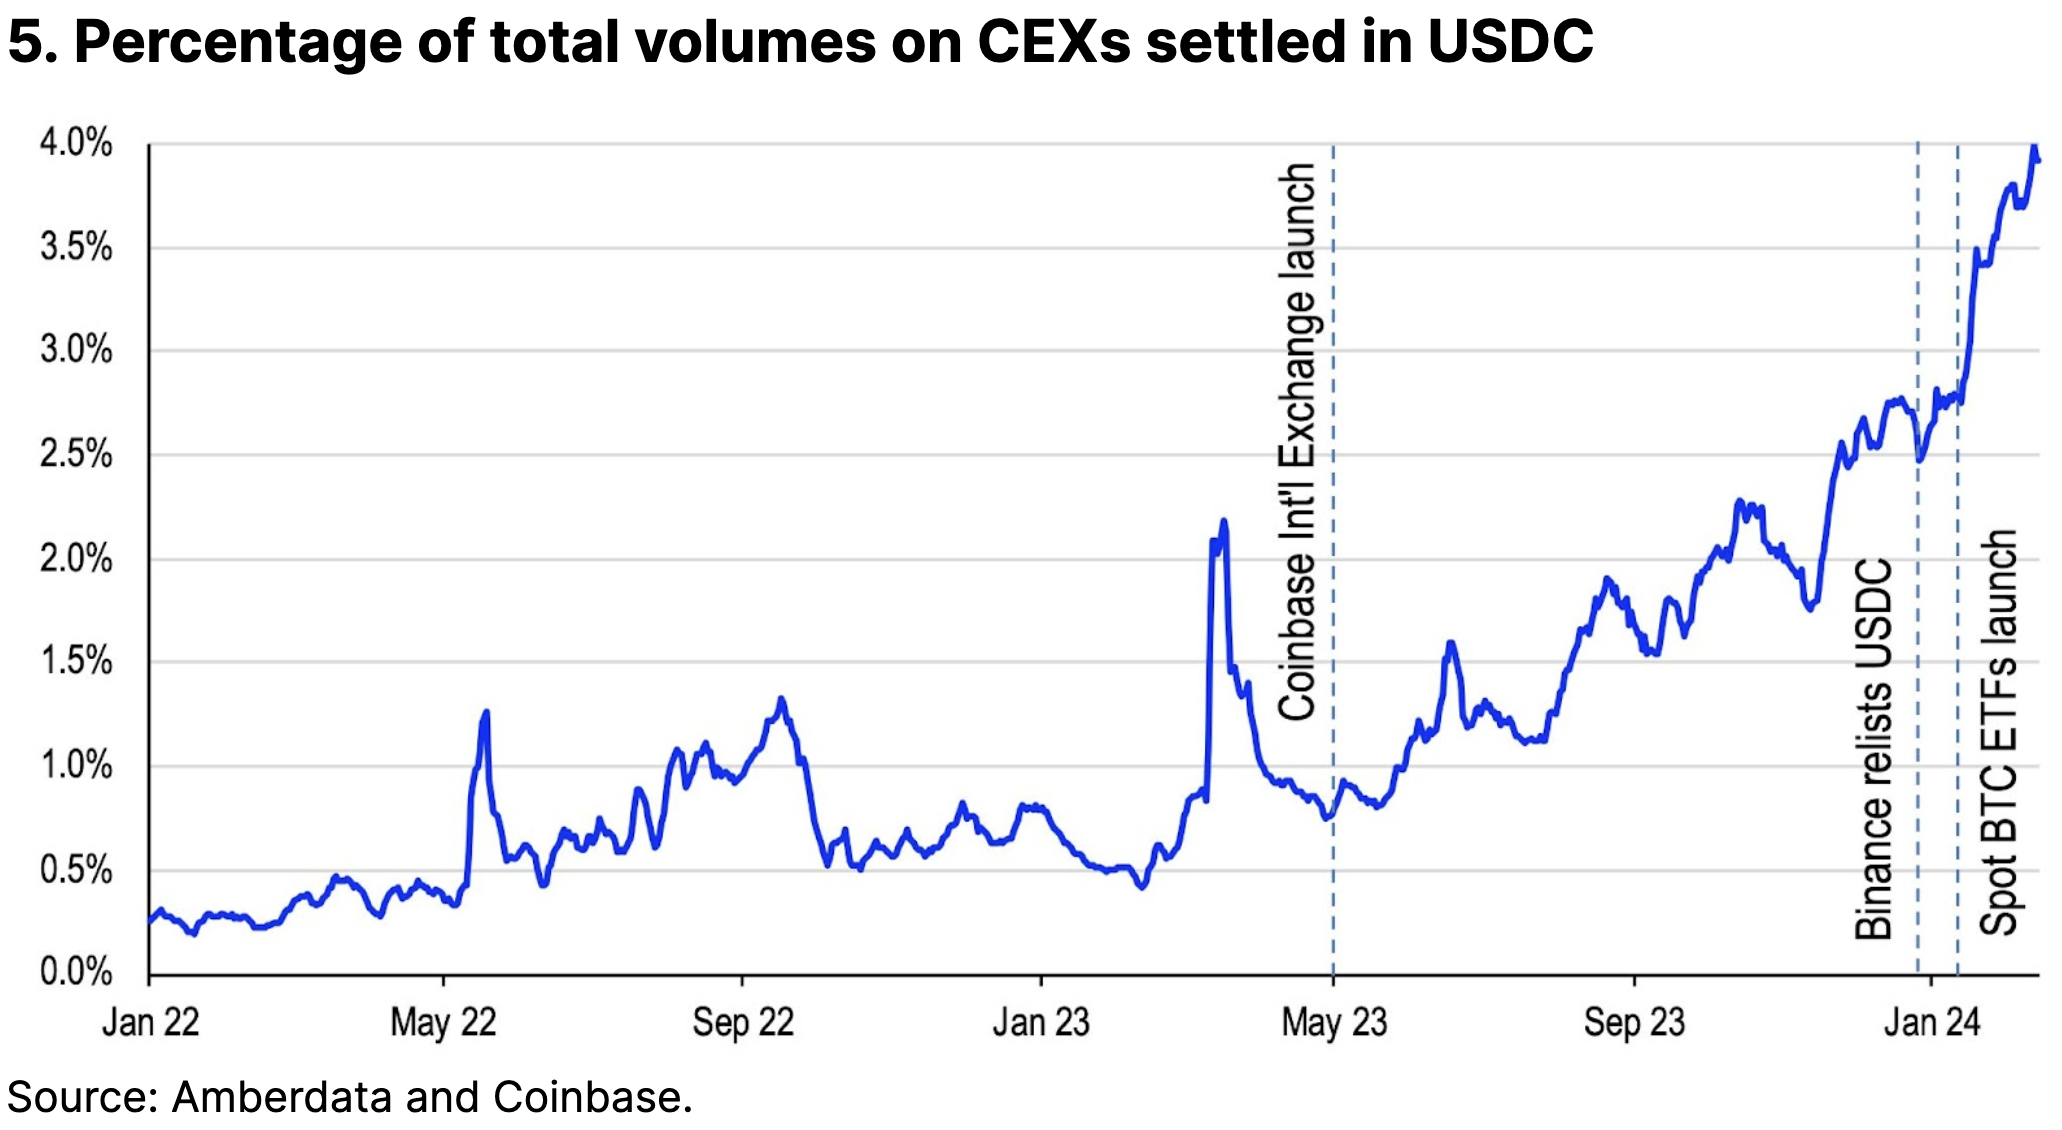
Comparatively, USDC’s overall liquidity and availability on global exchanges has only started to increase in recent months. The share of total spot and derivative trading volumes settled in USDC on CEXs has increased sharply from 0.8% at the start of 2023 to 3.9% as of February 15, 2024.
This has been coincident with the the launch of Coinbase International Exchange in May 2023 as well as the relisting of USDC against several trading pairs on Binance in late 2023, giving USDC a greater presence in non-US markets. More recently, Coinbase also began assessing fees on net conversions of USDC to USD on amounts in excess of $75M per rolling 30-day period, although that only started on February 5. However, above all, chart 5 shows that the launch of spot bitcoin ETFs in the US has helped push trading volumes to USD order books, which tends to benefit USDC order books as well because of their close correlation.
Moreover, Coinbase launched a renewable six-month USDC Market Maker Program on December 1, 2023 to help support the growth of USDC within the crypto ecosystem by incentivizing market makers to provide liquidity across a number of ecosystem partners. The liquidity provisioning program is meant to improve order book health for a variety of USDC products (spot and perps) and ensure a seamless consumer experience.
Initial results suggest that USDC’s share of the perps market has more than tripled between October 1, 2023 and January 31, 2024 (and 5x since the start of 2023). That said, at 2.6% of global perpetual futures volumes, this is still far below USDT’s dominant 84.4% share of perp volumes.
Interestingly, in the spot market, both USDT and USDC have simply kept pace proportionally with the sharp rise in daily volumes across all trading pairs, as overall global spot activity on CEXs have risen from an average of $14.0B in October 2023 to an average of $29.5B in January 2024. Currently, USDT is the base currency for 72% of all spot trading volumes on CEXs, while USDC is the base currency for 12% of spot volumes. Spot trading accounts for 22% of total CEX activity.
Note that we’ve recently seen a visible improvement in the market depth for USDC-based BTC and ETH pairs compared to USDT as well. For example, the market depth for BTC/USDC perps on Binance, ByBit, Coinbase International Exchange and OKX collectively increased by around $1.2M on all trades (sum of all bids and asks) within 3bps of the mid-price since end-2023. (This is based on the average of the last two weeks of February compared to the average of the last two weeks in December 2023.) That’s more than than the $910M growth observed for BTC/USDT perps over the same period.
Similarly, the market depth for ETH/USDC perps increased by $1.4M since the end of 2023, compared to an increase of only $920M for ETH/USDT perps on the same exchanges. That said, the 3bps market depth for the BTC/USDT trading pair is about 80% greater than the market depth for BTC/USDC (about $3-4M on both the bid and ask sides), and 33% greater for ETH/USDT vs ETH/USDC (around $1M or less).
USDC’s use onchain
Stablecoin-based trading pairs comprise a majority 65% of the $2.6B of average daily trading activity on DEXs, which themselves represent only a small percentage of market activity within the crypto ecosystem. Among those pairs, USDC tends to play a bigger role in settling trades than USDT, capturing upwards of 50% of the share of trading volumes on DEXs.
That said, this is down from around 60% in early 2023 due to the factors listed in section two above – as well as the rise of competitors like crvUSD. Meanwhile, USDT’s share of total DEX trading volumes has increased from 30% in early 2023 to 40% in 2024, in part because it absorbed the market share of BUSD. Third place DAI has maintained a consistent 5-6% contribution to stablecoin trading volumes on DEXs over the last year.
Importantly however, CoinMetrics data indicates that USDC typically facilitates transactions of much larger size than USDT onchain. On average, USDC transactions are on the order of $75,000 to $80,000 per transfer on average, compared to $30,000 to $35,000 for USDT on Ethereum and much less (below $7000 average) on Tron.
Note that stablecoin transfer volumes have recently started to accelerate on Solana, according to Artemis – the majority (85%) of which is attributed to USDC. Solana’s transfer volumes have risen from $90B in November (representing a 9.7% stablecoin share by network) to $531B in January (giving it a 33.9% share, more than either Ethereum or Tron, where most stablecoin activity has historically taken place).
However, those figures may not necessarily reflect real economic activity on the network, according to DLNews. That is, it may in fact simply be capturing market-making behavior on Solana-based Phoenix exchange (where much of the stablecoin transfer volumes are taking place), whereas other networks do not record onchain market-maker transfers.
Conclusion
Progress in the growth of USDC liquidity and usage outside of the US is advancing rapidly, reflected in the sharp increase in USDC supply over the last few months. That reflects the overall pickup in both retail and institutional demand as crypto has moved into a new phase of its market cycle after the launch of spot bitcoin ETFs in the US, contributing to fresh capital inflows. Moreover, trading volumes on USDC-based pairs are expanding on centralized exchanges after representing negligible activity at the start of 4Q23, although they still pale in comparison to USDT-settled trading in spot and perps overall. We expect these market cap and liquidity trends to continue through the remainder of this year.