Although crypto is a global industry, trading flows during US market hours (and the latter part of European hours) have a clear outsized impact on the liquidity and price volatility in the market. This was true before US-based spot bitcoin ETF approvals, and has only become more pronounced since, particularly in centralized exchange (CEX) platforms. The increased volume also translates into wider price variations during US and European trading hours as well as an overall wider range of full day market returns.
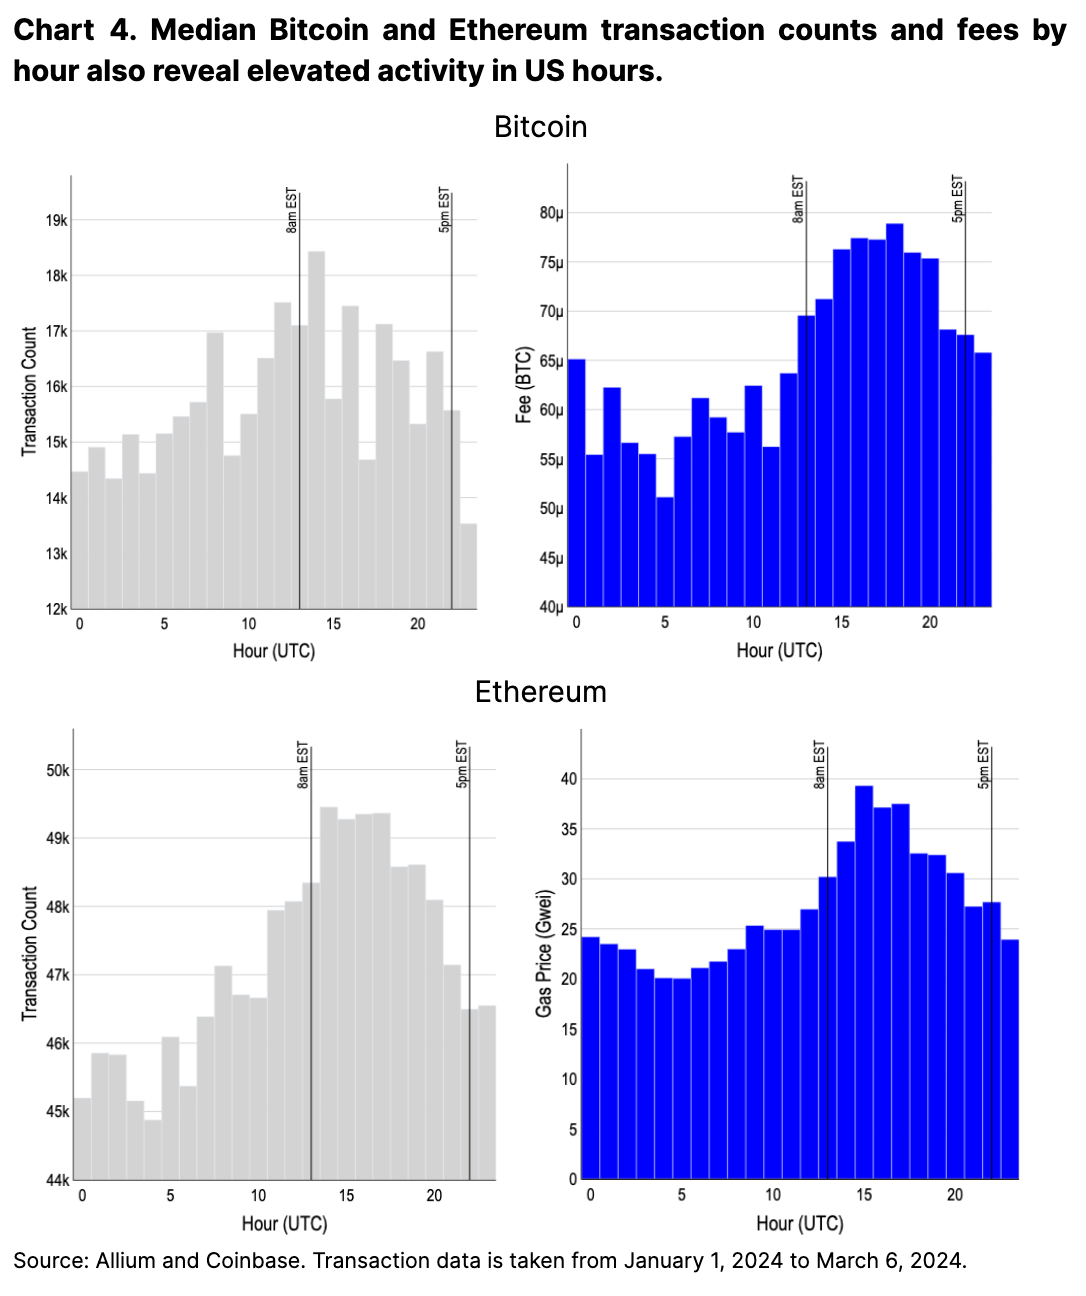
Onchain metrics reflect a similar pattern. Both Bitcoin and Ethereum transaction counts peak during US hours, seeing as much as a 50% increase in transaction costs between high and low traffic hours. Decentralized exchange (DEX) volumes also mirror that of their CEX counterparts, though the US dominance onchain is not as clear cut. Stablecoin usage appears evenly distributed across both US and European hours in both volume transferred and the number of active users
Altogether, we think this data plainly reveals the US’s large influence for both trading and onchain activity despite existing regulatory challenges. The success of spot bitcoin ETFs in the US and its pronounced impact on the broader bitcoin markets further suggests to us that regulatory clarity in the US plays a pivotal role in unlocking new capital inflows into crypto marke
Centralized Exchanges
Beyond enabling access to a new institutional pool of capital, a second order effect of the US spot bitcoin ETFs has been the increased concentration of CEX volumes during US hours. Prior to the ETF approvals, peak volumes already occurred during US market open hours from 9-10 am EST and were approximately double that of market opening hours in Asia and Europe (see Chart 1). Following the launch of spot ETFs, however, US volumes across all of spot, perpetual futures, and non-perpetual futures products have risen to nearly triple that of other market hours.
Since January 11, spot CEX volumes during US hours have grown 130-200%, well in excess of the 80-120% growth in Asian and European volumes. Perpetual futures have also seen volumes during peak US hours grow by nearly 70% (2.3B to 3.8B) compared to a 20 and 50% growth in peak Asia and Europe hours (1B to 1.2B and 1.5B respectively). The increase in perpetual futures volumes is particularly striking as these instruments are almost exclusively traded outside of the US. In our view, this could suggest offshore players may be taking advantage of the stronger spot liquidity during US hours or that US traders are leveraging offshore entities to gain access to these markets.
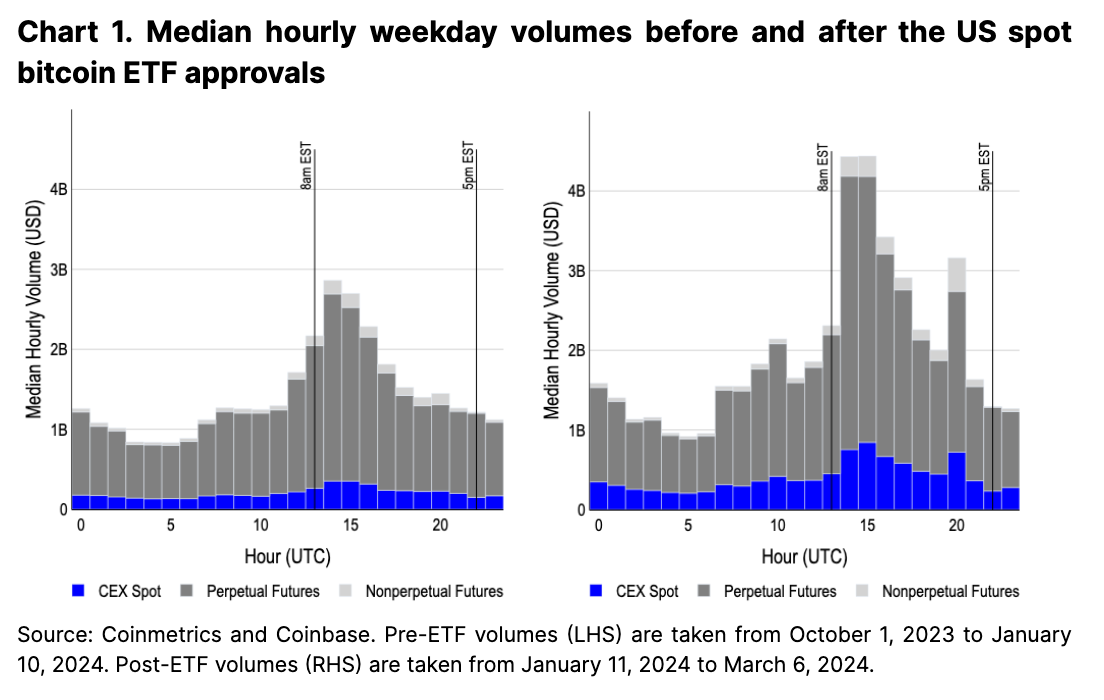
The launch of spot ETFs has also led to a new surge in volume at 3pm New York time across all product categories. This is primarily because ETF issuers want to keep their funds’ prices aligned with their benchmarks, and six of the 10 spot ETFs track the CME CF Bitcoin Reference Rate - New York Variant (BRRNY) that snapshots between 3-4pm New York time. Consequently, this is when authorized participants aim to acquire the underlying bitcoin as part of the in-cash creation (and redemption) model, often hedging their positions via regulated products like CME bitcoin futures (for those without access to perp markets abroad). In fact, the hour between 3-4pm New York time is the most heavily traded hour of CME bitcoin futures by more than 60%.
Return Variations
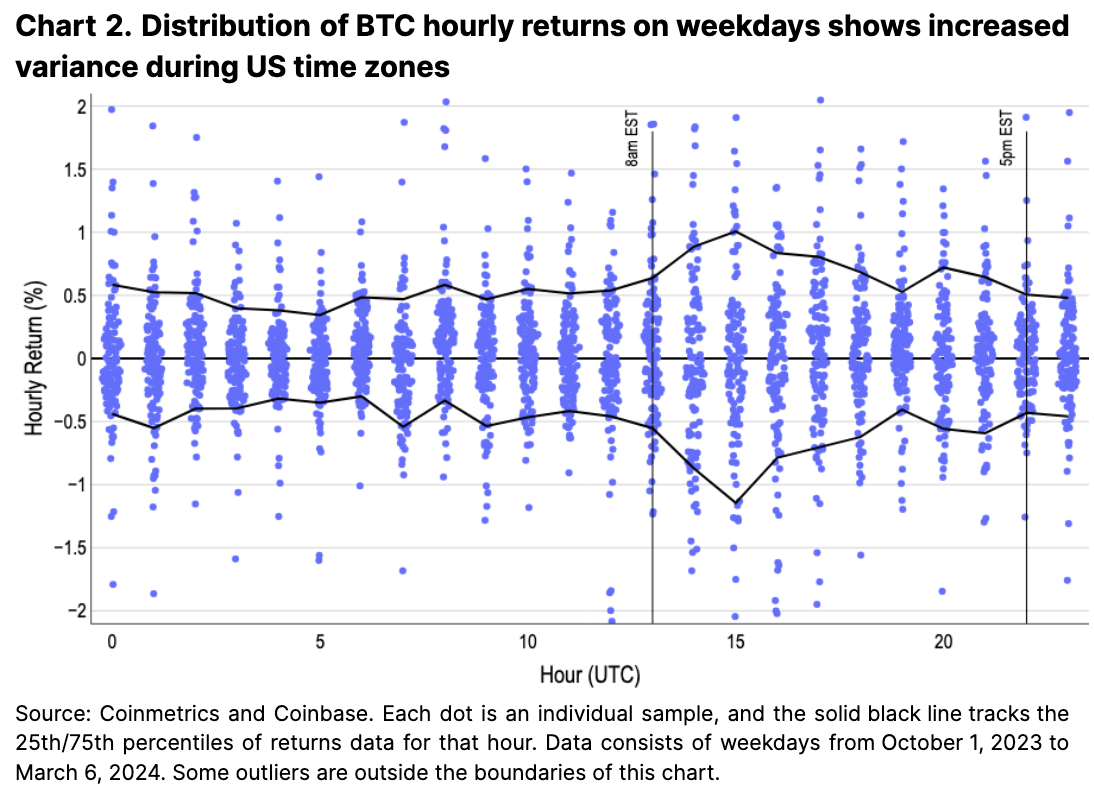
The dominance of US-based flows in bitcoin are also reflected in its price performance. Chart 2 depicts a strip plot of hourly returns in blue (showcasing the density distribution of returns), as well as black lines demarcating the boundaries between the 10th and 90th percentiles. The hours with wider ranges of returns correspond to that of the earlier volume chart, indicating that the high trading volumes in early US market hours generally materialize in wider price swings. This suggests that early US market hours present the best opportunity for intraday traders in terms of both liquidity and volatility.
Measuring full market day returns (from 8am to 5pm) on different financial center time zones also sheds light on regional differences more broadly. Chart 3’s violin plots show that New York and London hours have a wide distribution of returns. (The plot shows a probability for returns using a kernel density estimation where the width of a “violin” indicates the probability of getting that return.) In comparison, returns during Hong Kong hours are far more concentrated. We think this further underscores the importance of traders in the US (and Europe to an extent – their closing hours overlap with US opening hours) in driving the price of bitcoin.
Globally Distributed Networks
Activity on both Bitcoin and Ethereum also peak during US hours despite their globally accessible and decentralized nature. This is evidenced in increased transaction costs during US hours of more than 50% from their lows (see Chart 4). In one part, we think elevated usage during US hours is a result of a large population that is both technologically savvy and capital rich relative to other parts of the world. At the same time, we also think this activity could be caused in part by US-based traders managing positions across various wallets and exchanges (in line with the increase in CEX volumes during this time).
Onchain DEX volumes further reaffirm the pattern of peak activity during US market hours, though the discrepancy is not as pronounced compared to CEX differences. The noticeable surge in DEX volumes at Asia market open hours (UTC 0) is approximately 70% that of peak US hours, compared to less than 30% of peak US hours on CEXs (see Chart 5). This volume ratio hasn’t changed meaningfully before and after ETF approvals.
We think the differences in DEX volumes aren’t as pronounced as that of CEXs due to the relative nascency of DEXs and the vastly different market structures underpinning it (e.g. traditional central limit order books versus automated market makers). This enables a newer and somewhat more level playing field, that only began in earnest in 2019 following the seminal Flash Boys 2.0 paper on profitable onchain trading strategies (and maximally extractable value more broadly).
Separately, we don’t think the number of unique trading addresses is a clear proxy for regional usage. The numbers are warped as a result of airdrop farming, particularly on Solana where transaction fees are cheap. The airdrop for Jupiter, Solana’s leading DEX aggregator, has only released its first of four rounds. It hasn’t committed to firm dates for the following rounds yet, so we think this metric could continue to be considerably skewed for some time.
Apart from DEXs, we think that stablecoin transfers are another key indicator for crypto usage by timezone. Importantly, stablecoin transfer usage statistics are generally not distorted by short-term airdrop incentives in the same way DEX activity is. Also interestingly, this is the first scenario where there is no heavy activity skew towards US market hours.
Solana USDC transfers, which account for the majority of volume, peaks in European hours, though Ethereum-based volumes skew towards US hours (see Chart 6). That said, the overall number of distinct senders does appear to have a soft peak early in the US day, though not by much (17k active hourly senders at peak vs 13k senders at the lows). USDT volumes likewise peak during European market hours, and the number of unique senders reaches a consistent high during the European daytime. This suggests to us that the adoption of USD denominated stablecoins has reached more global penetration, particularly in areas where access to dollar assets are not as seamlessly integrated into the local financial rails.
Conclusion
The overall dominance of the US (and Europe to a lesser extent) in crypto markets may be somewhat surprising given the generally challenging US regulatory environment over the past several years. That said, we think that America’s outsized influence in crypto makes sense more broadly due to their strong capital base, market investment culture, and tech savvy population.
The landmark approval of spot bitcoin ETFs in the US unlocked significant new sources of capital and has resulted in markets further centering on US activity. In our view, this highlights the outsized importance of US regulations and policy in shaping the crypto markets. We also think these findings underscore the relevance of investor sentiment in the US as the leading driving force in market movements relative to other regions. As shown with the US spot bitcoin ETF approvals, we think that further US regulatory clarity and more frictionless access to crypto in the US could continue to increase US dominance in the crypto markets.