Financials Prediction Markets

S&P price on Oct 22, 2026 at 4pm EDT?
7,675 or above market icon
7,675 or above
7,670 or above market icon
7,670 or above
Oct 21 @ 8:00 PM
S&P close price end of 2026?
7,800 to 7,999.99 market icon
7,800 to 7,999.99
7,600 to 7,799.99 market icon
7,600 to 7,799.99
$15,970,845 vol
10Y US Treasury yield on Oct 22, 2026?
5% or above market icon
5% or above
5.02% or above market icon
5.02% or above
Oct 21 @ 7:30 PM
10Y US Treasury yield on Dec 31, 2027?
5% or above
5.25% or above
$240,494 vol
S&P price on Oct 22, 2026 at 1pm EDT?
7,675 or above market icon
7,675 or above
7,680 or above market icon
7,680 or above
Oct 21 @ 8:00 PM
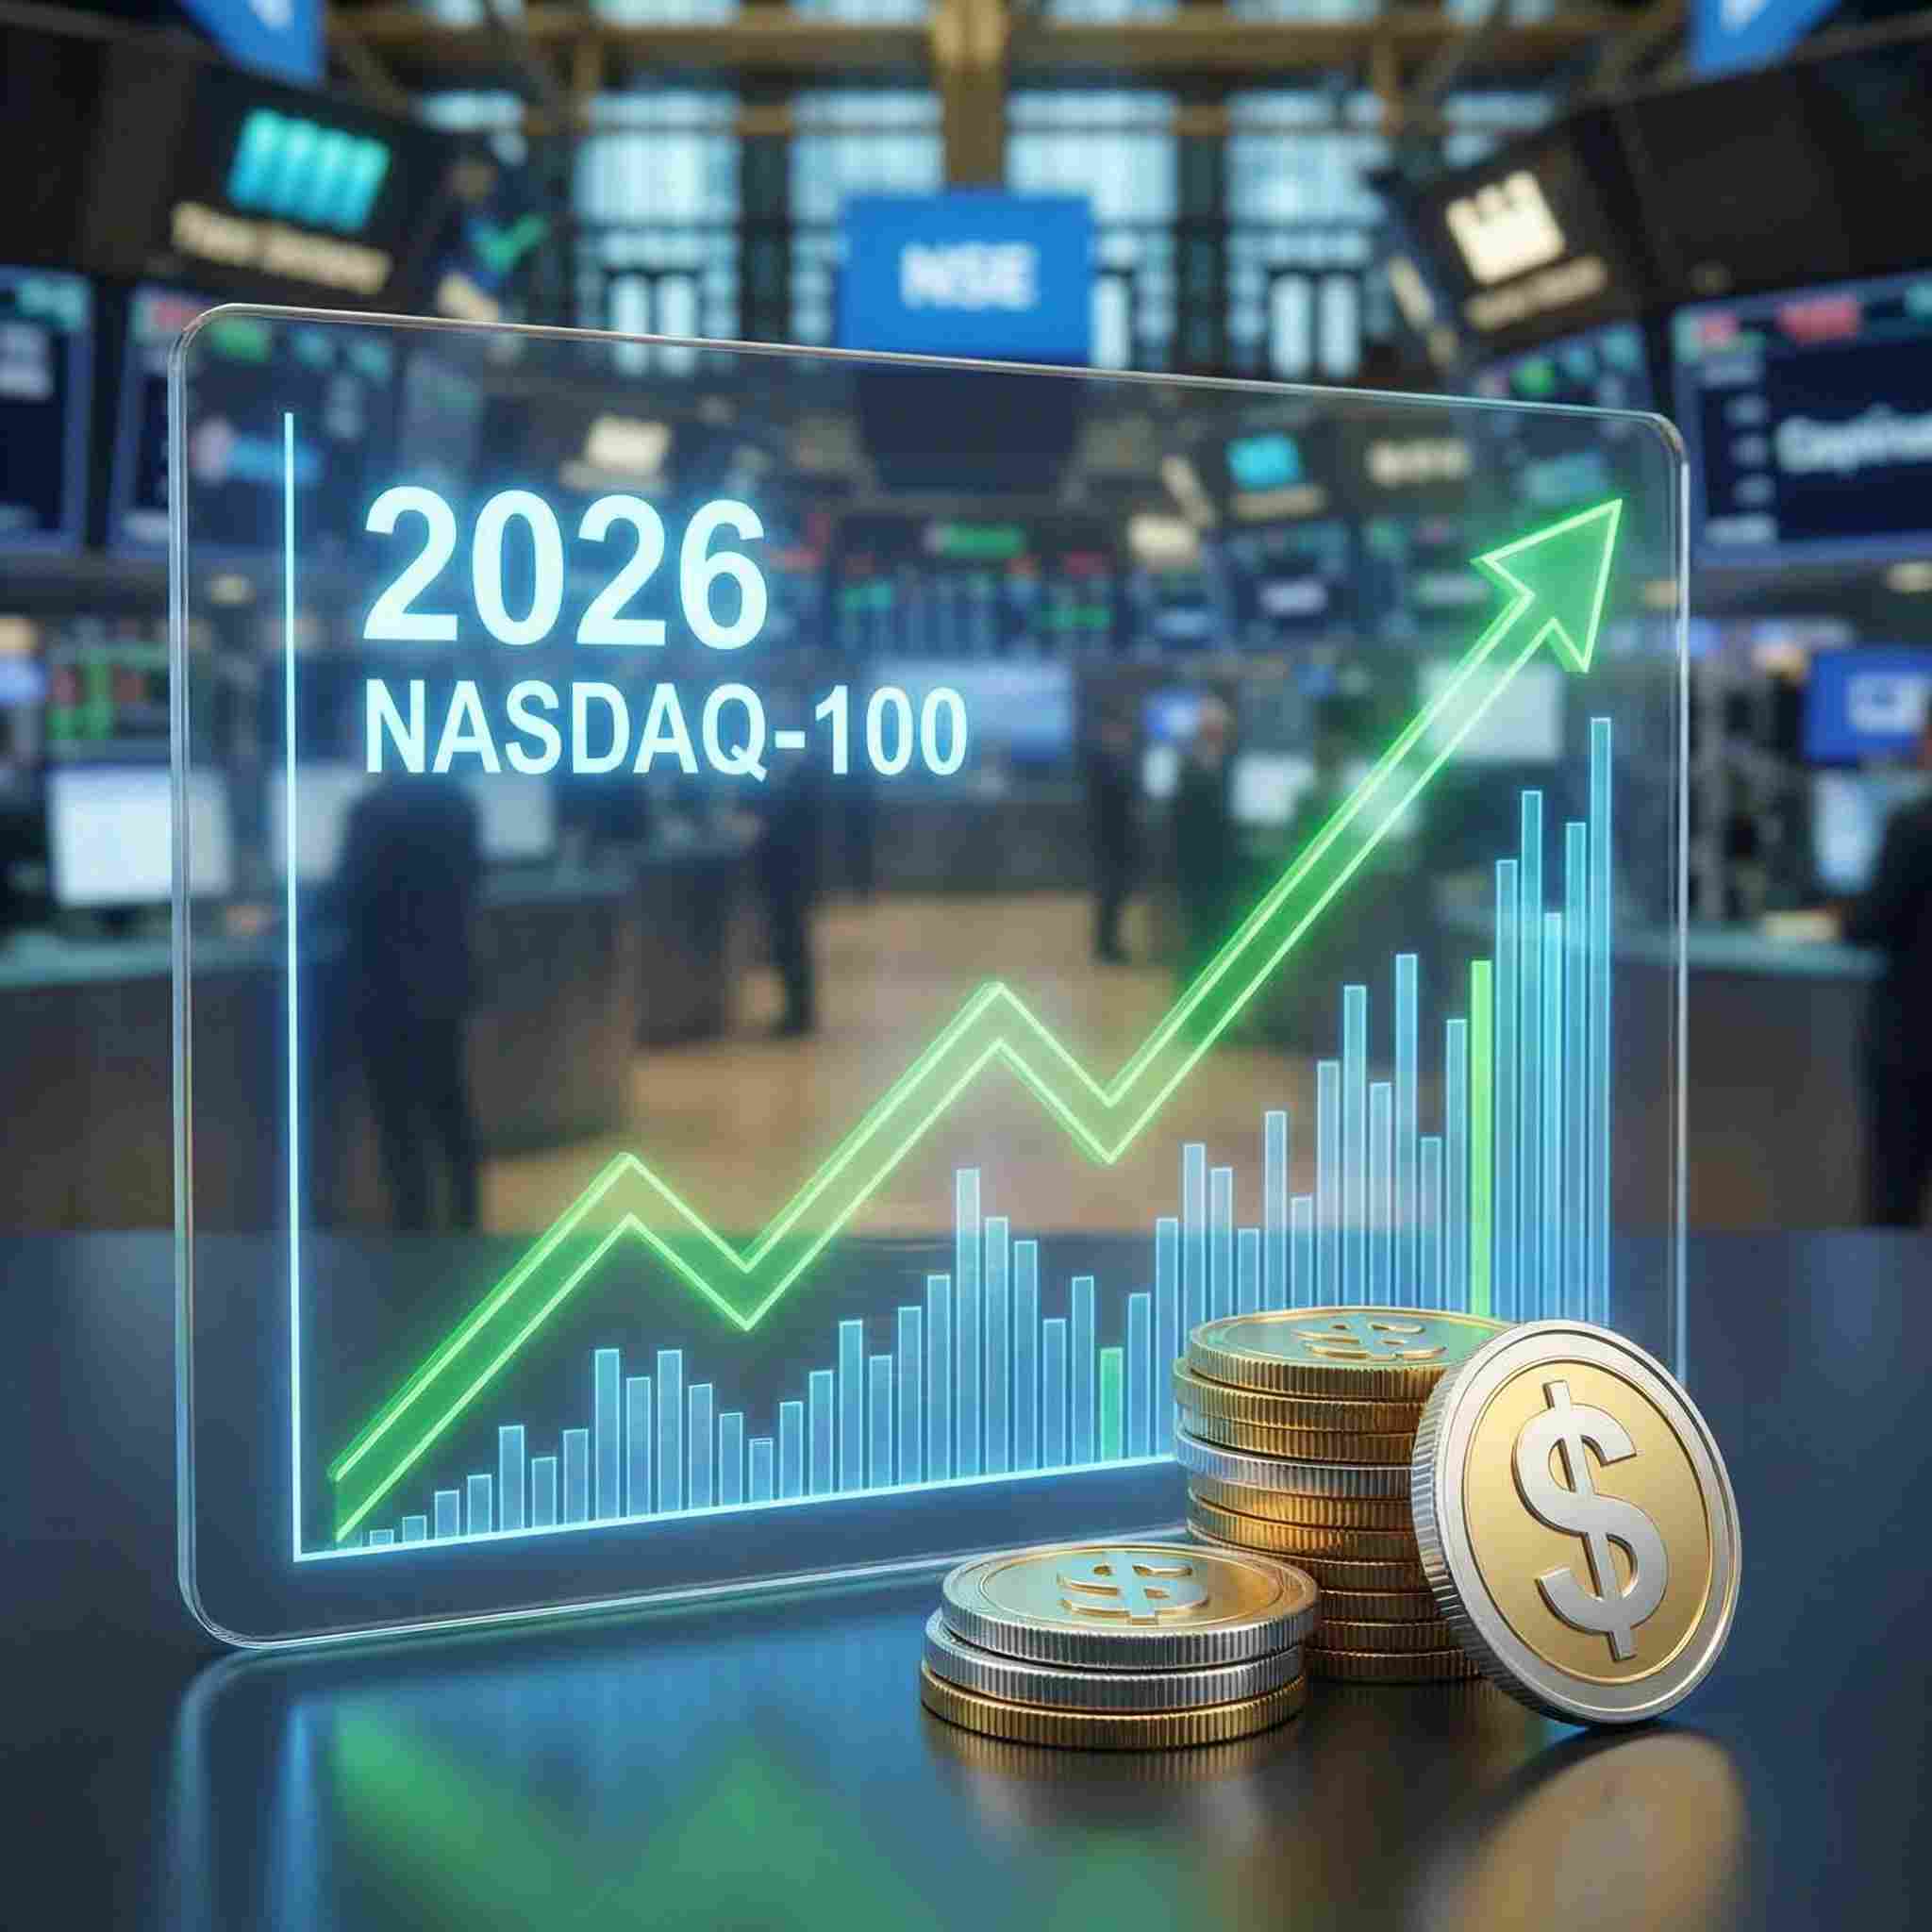
Nasdaq-100 close price end of 2026?
30,500 to 30,999.99 market icon
30,500 to 30,999.99
33,000.01 or above market icon
33,000.01 or above
$9,875,444 vol
(Pyth Index.US30/USD) price on Oct 22, 2026 at 4pm EDT
At least $52,375 market icon
At least $52,375
At least $52,875 market icon
At least $52,875
Oct 21 @ 8:00 PM
2Y US Treasury yield on Oct 22, 2026?
4.7% or above market icon
4.7% or above
4.76% or above market icon
4.76% or above
Oct 21 @ 7:30 PM
Will the S&P finish positive this year?
$2,823,115 vol
How low will the S&P get this year?
6,300 or below market icon
6,300 or below
6,000 or below market icon
6,000 or below
$1,860,485 vol
S&P price range on Oct 22, 2026 at 4pm EDT?
7,650 to 7,674.9999 market icon
7,650 to 7,674.9999
7,675 to 7,699.9999 market icon
7,675 to 7,699.9999
$8,555 vol
2Y US Treasury yield on Oct 23, 2026?
4.87% or above market icon
4.87% or above
4.77% or above market icon
4.77% or above
Oct 16 @ 7:30 PM
How high will the S&P get this year?
8,000 or above market icon
8,000 or above
8,200 or above market icon
8,200 or above
$2,026,783 vol
7Y US Treasury yield on Oct 22, 2026?
5.02% or above market icon
5.02% or above
5.04% or above market icon
5.04% or above
Oct 21 @ 7:30 PM
30Y US Treasury yield on Oct 22, 2026?
5.4% or above market icon
5.4% or above
5.42% or above market icon
5.42% or above
Oct 21 @ 7:30 PM
How low will the 10-year US Treasury yield get by Oct 30, 2026?
5.06% or below
5.05% or below
$26,779 vol
5Y US Treasury yield on Oct 22, 2026?
4.95% or above market icon
4.95% or above
4.97% or above market icon
4.97% or above
Oct 21 @ 7:30 PM
Will Bitcoin outperform gold in 2026?
$616,622 vol
Treasury spread 10Y-2Y by Dec 31, 2026
Above .9%
Above .8%
$18,932 vol
10Y US Treasury yield on Oct 23, 2026?
5.08% or above market icon
5.08% or above
5.14% or above market icon
5.14% or above
Oct 16 @ 7:30 PM
Will the 10Y US Treasury yield hit 5.50% by Oct 31, 2026?
$24,571 vol
How low will the 30-year US Treasury yield get by Oct 30, 2026?
5.36% or below
5.41% or below
$16,651 vol
How high will the Nasdaq-100 price get in 2026?
31,400 or above
31,600 or above
$371,980 vol
S&P price at year-end?
7,700 or above
7,800 or above
$96,659 vol
How low will the Nasdaq-100 get in 2026?
22,400 or below
22,800 or below
$104,587 vol
NASDAQ-100 price at year-end?
30,000 or above
31,000 or above
$108,716 vol
How high will the 5-year US Treasury yield get in Oct 2026?
5.17% or above
5.21% or above
$60,276 vol
Annual Return: S&P 500 Total Return Vs. Gold?
S&P 500 Total Return Index
Gold
$60,517 vol
How high will the Dow Jones Industrial Average get in 2026?
At least $54,000
At least $56,000
$23,784 vol
How high will the 2-year US Treasury yield get in Oct 2026?
4.94% or above
4.93% or above
$34,174 vol
5Y US Treasury yield on Oct 23, 2026?
4.86% or above market icon
4.86% or above
4.96% or above market icon
4.96% or above
Oct 16 @ 7:30 PM
How high will the 30Y US Treasury yield get by Jan 1, 2027?
5.7% or above
5.75% or above
$10,477 vol
Loading
Loading
Loading
Loading
Loading
Loading
Loading
Loading
Loading
Loading
Loading
Loading
Loading
Loading
Loading
Loading
Loading
Loading
Loading
Loading
Loading
Loading
Loading
Loading
Loading
Loading
Loading
Loading
Loading