Financials Prediction Markets

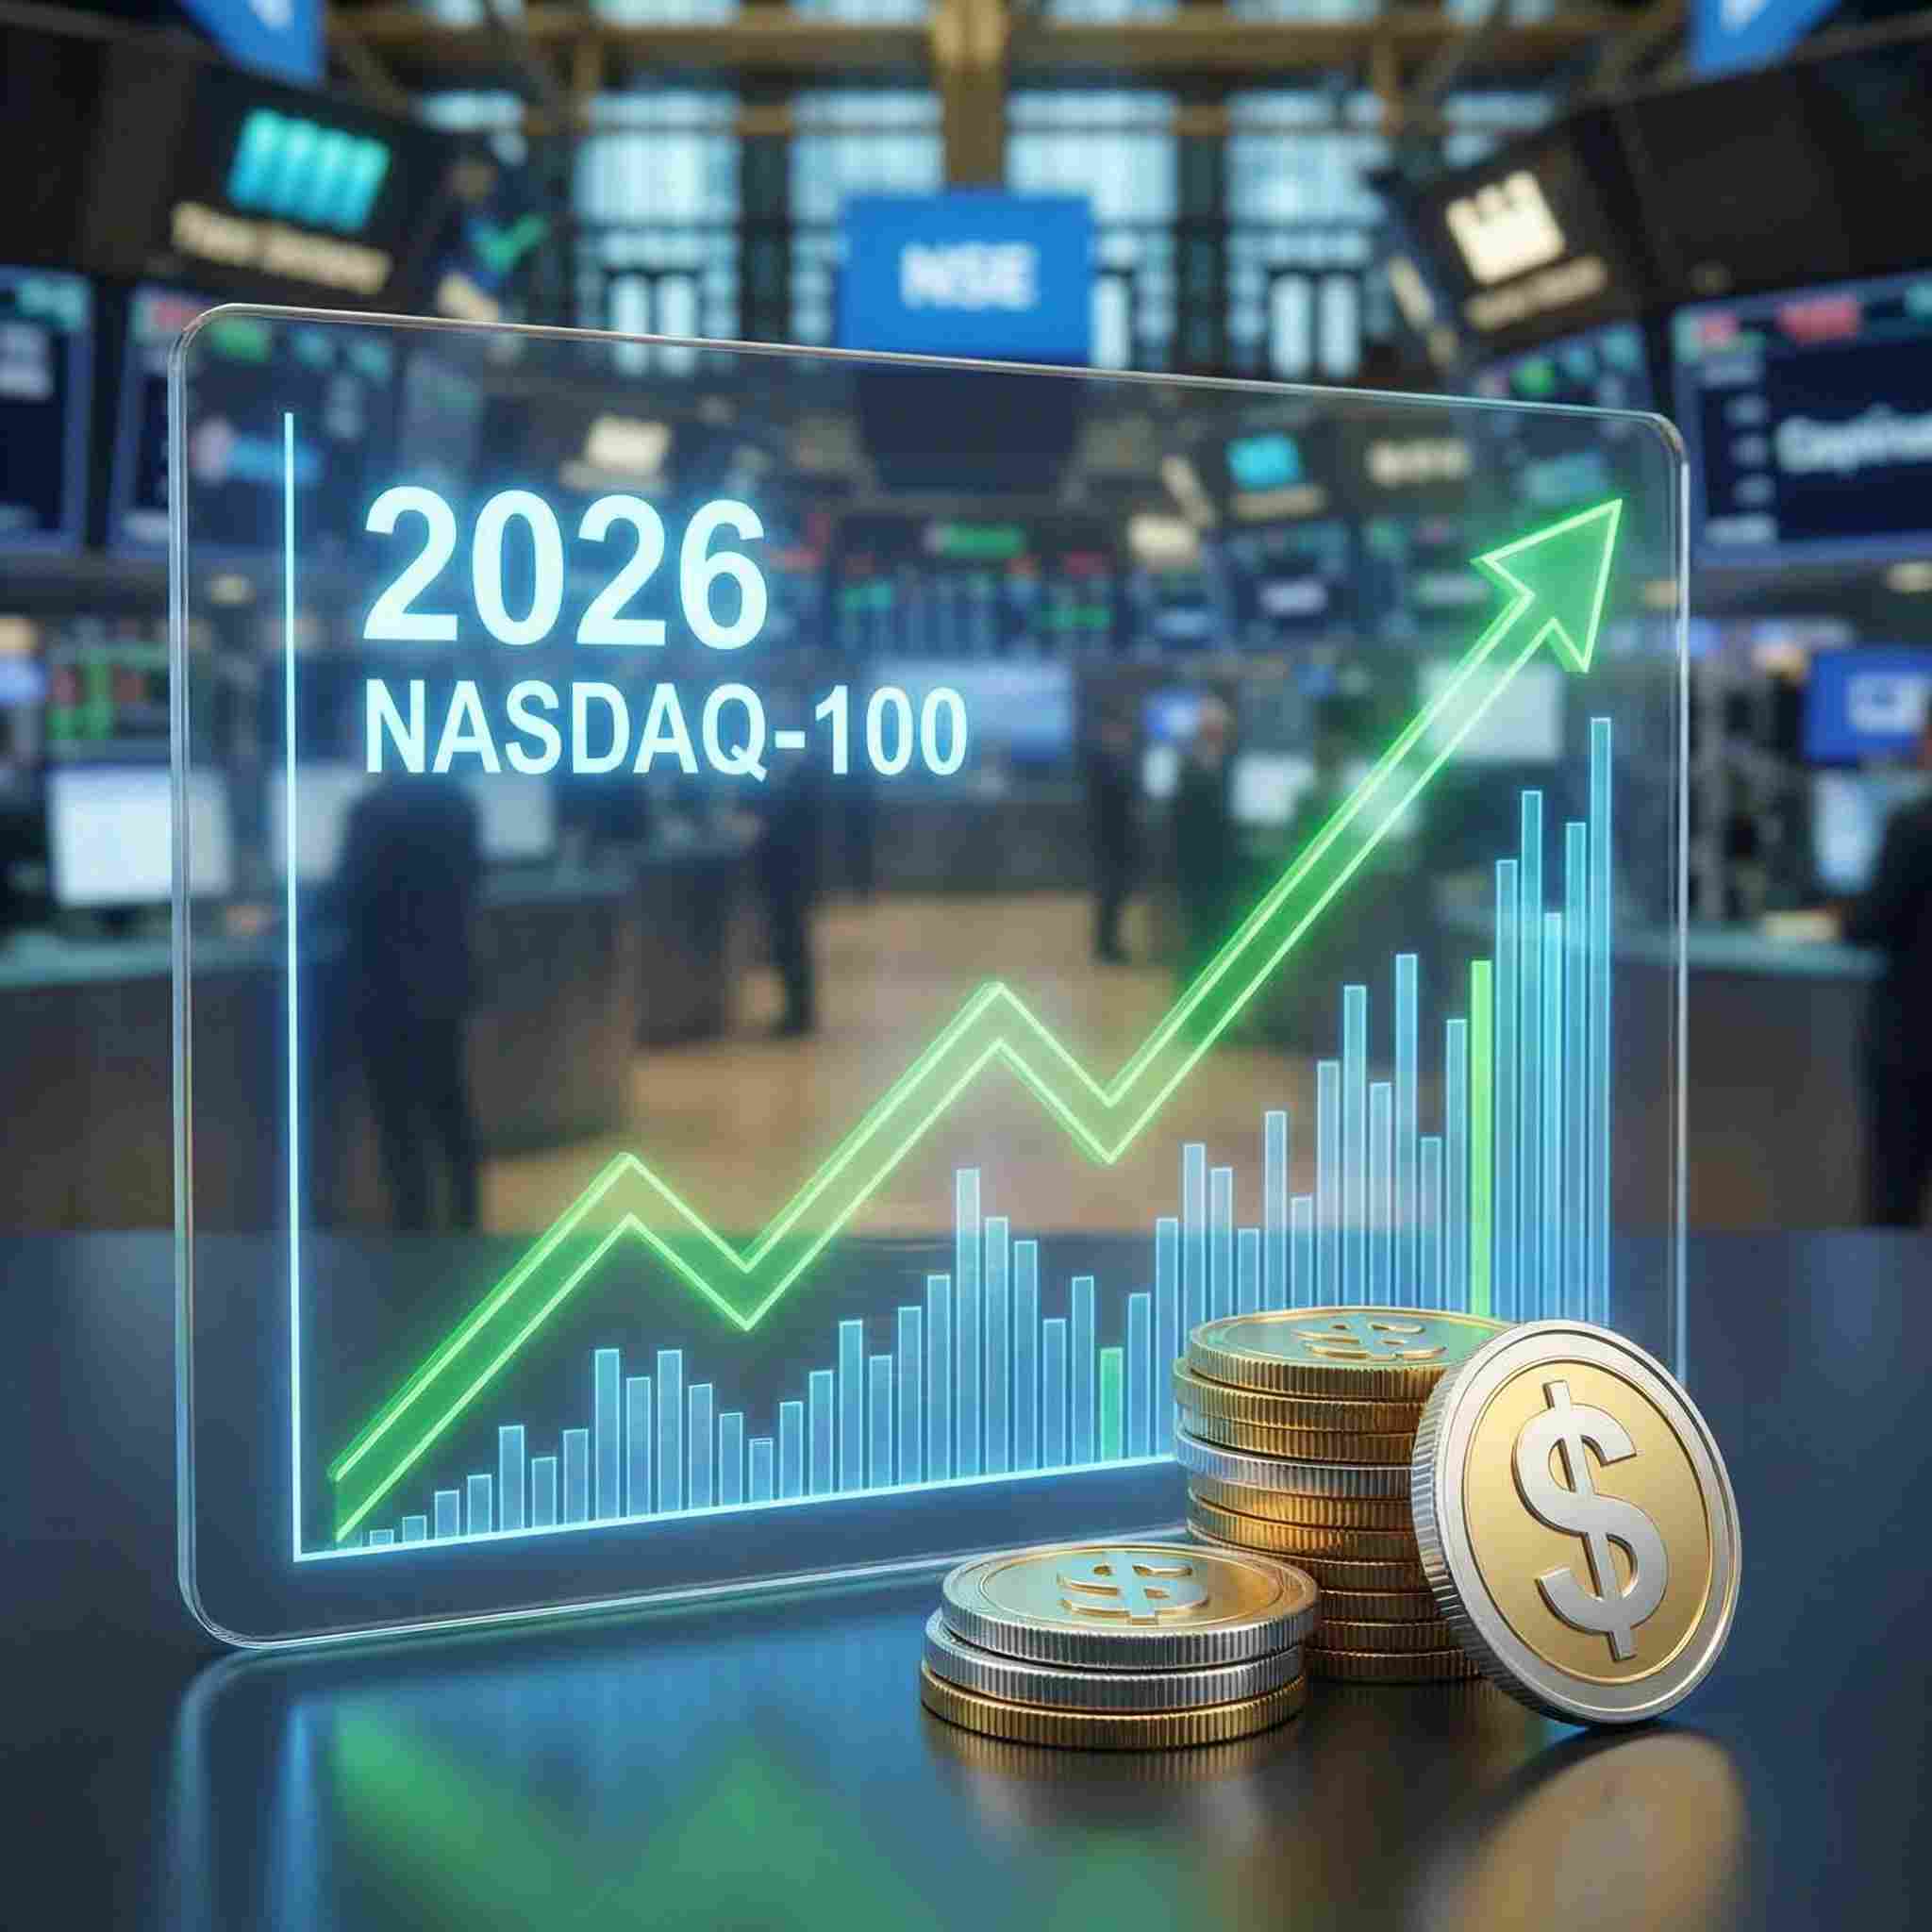
Nasdaq-100 close price end of 2026?
30,000 to 30,499.99 market icon
30,000 to 30,499.99
30,500 to 30,999.99 market icon
30,500 to 30,999.99
$9,822,538 vol
(Pyth Index.US30/USD) price on Oct 21, 2026 at 4pm EDT
At least $52,525 market icon
At least $52,525
At least $52,600 market icon
At least $52,600
Oct 20 @ 8:00 PM
S&P close price end of 2026?
7,800 to 7,999.99 market icon
7,800 to 7,999.99
8,000 to 8,199.99 market icon
8,000 to 8,199.99
$15,844,062 vol
Nasdaq-100 price on Oct 21, 2026 at 10am EDT?
29,610 or above market icon
29,610 or above
29,620 or above market icon
29,620 or above
Oct 20 @ 8:00 PM
S&P price on Oct 21, 2026 at 4pm EDT?
7,710 or above market icon
7,710 or above
7,745 or above market icon
7,745 or above
Oct 20 @ 8:00 PM
How high will the S&P get this year?
8,000 or above market icon
8,000 or above
8,200 or above market icon
8,200 or above
$2,017,725 vol
Fear & Greed Index on Oct 23, 2026?
Fear
Extreme Fear
Oct 23 @ 1:30 PM
S&P price on Oct 21, 2026 at 10am EDT?
7,730 or above market icon
7,730 or above
7,735 or above market icon
7,735 or above
Oct 20 @ 8:00 PM
Will the S&P finish positive this year?
$2,807,012 vol
Nasdaq-100 price on Oct 21, 2026 at 4pm EDT?
29,630 or above market icon
29,630 or above
29,760 or above market icon
29,760 or above
Oct 20 @ 8:00 PM
Nasdaq-100 price on Oct 21, 2026 at 3pm EDT?
29,640 or above market icon
29,640 or above
29,650 or above market icon
29,650 or above
Oct 20 @ 8:00 PM
(Pyth Index.US30/USD) price on Oct 21, 2026 at 10am EDT
At least $52,500 market icon
At least $52,500
At least $52,575 market icon
At least $52,575
Oct 20 @ 8:00 PM
S&P 500 Daily Up/Down
TODAY @ 1:30 PM
How low will the Nasdaq-100 get in 2026?
22,800 or below
22,400 or below
$102,583 vol
NASDAQ-100 price at year-end?
30,000 or above
31,000 or above
$107,159 vol
How high will the Nasdaq-100 price get in 2026?
31,400 or above
31,600 or above
$369,232 vol
How low will the S&P get this year?
6,300 or below market icon
6,300 or below
6,000 or below market icon
6,000 or below
$1,848,410 vol
IBOVESPA closing level on Oct 26, 2026
At least 215,000 points market icon
At least 215,000 points
At least 216,000 points market icon
At least 216,000 points
$1,050 vol
NASDAQ-100 Daily Up/Down
TODAY @ 1:30 PM
Nasdaq-100 price on Oct 21, 2026 at 11am EDT?
29,590 or above market icon
29,590 or above
29,600 or above market icon
29,600 or above
Oct 20 @ 8:00 PM
S&P price at year-end?
7,800 or above
7,900 or above
$94,339 vol
Nasdaq-100 price on Oct 21, 2026 at 2pm EDT?
29,370 or above market icon
29,370 or above
29,760 or above market icon
29,760 or above
Oct 20 @ 8:00 PM
Nasdaq-100 price on Oct 21, 2026 at 12pm EDT?
29,600 or above market icon
29,600 or above
29,630 or above market icon
29,630 or above
Oct 20 @ 8:00 PM
Nasdaq-100 price on Oct 21, 2026 at 1pm EDT?
29,620 or above market icon
29,620 or above
29,640 or above market icon
29,640 or above
Oct 20 @ 8:00 PM
Annual Return: S&P 500 Total Return Vs. Gold?
S&P 500 Total Return Index
Gold
$59,289 vol
Will the NASDAQ-100 finish positive in 2026?
$346,127 vol
Fear & Greed Index on Nov 6, 2026?
Fear
Extreme Fear
Nov 6 @ 2:30 PM
Annual Return: S&P 500 Total Return Vs. BTC?
S&P 500 Total Return Index
BTC
$55,945 vol
Companies removed from the S&P 500 in Q4?
AES
Norwegian Cruise Line
$4,809 vol
S&P price range on Oct 23, 2026 at 4pm EDT?
7,750 to 7,774.9999 market icon
7,750 to 7,774.9999
7,725 to 7,749.9999 market icon
7,725 to 7,749.9999
$144 vol
Companies removed from the MSCI USA Index in Q4?
Deckers Outdoor
DICK'S Sporting Goods
Nov 11 @ 5:00 AM
S&P price on Oct 21, 2026 at 11am EDT?
7,685 or above market icon
7,685 or above
7,710 or above market icon
7,710 or above
Oct 20 @ 8:00 PM
Loading
Loading
Loading
Loading
Loading
Loading
Loading
Loading
Loading
Loading
Loading
Loading
Loading
Loading
Loading
Loading
Loading
Loading
Loading
Loading
Loading
Loading
Loading
Loading
Loading
Loading
Loading
Loading
Loading