Introduction
The economic relevance of bitcoin’s block reward halving is often viewed positively, as the event promises to enhance bitcoin’s prospective scarcity and support its supply-demand technicals. However, with only three recorded halving events in bitcoin’s history, actual evidence of how markets have reacted to these milestones is still limited.
Specifically, the challenge with judging the significance of these events is that it’s difficult to disentangle the idiosyncratic nature of the halving from exogenous factors like global liquidity, interest rates and moves in the multilateral USD index. Previous bitcoin halving episodes occurred alongside some important historical monetary and fiscal developments, for example.
In 2012, the Fed started to buy mortgage-backed securities and long-dated Treasuries as part of QE3. In 2016, Brexit may have stoked fiscal concerns in the UK and Europe and provided a catalyst for bitcoin buying. In 2020, global central banks and governments responded to the COVID-19 pandemic with unprecedented levels of stimulus, driving liquidity sharply higher.
Detrending bitcoin price action from the movements in such factors helps elucidate the situation somewhat. However, outside of the third halving, evidence that these halving events supported bitcoin price action is not entirely clear cut. Moreover, global liquidity appears to have peaked in the near term, which further obfuscates what the net effect on bitcoin’s price behavior might ultimately be.
Peak global liquidity
Lower liquidity has been observed across all asset classes in recent weeks, in part due to a 3.5% decline in global central bank balance sheet holdings over the last two months. Among the Federal Reserve, European Central Bank, People’s Bank of China, Bank of Japan, Bank of Canada and Bank of England, tightening conditions have reduced this broad measure of global liquidity to $29.2 trillion as of end-May. Recall that global liquidity peaked in mid-February 2022 near $33.1 trillion, contracted by $3.8 trillion through end-2022 and subsequently picked up in 1Q23. See chart 1.
Cryptocurrency performance has been tracking the movements in global liquidity more closely after the deleveraging events that took place in this space during May-June 2022. In fact, the relative differential between the drain in global central bank liquidity and reduction in the crypto market cap around that time suggests that those idiosyncratic events had around a $724B impact on the asset class. At the moment, the total crypto market cap currently represents 3.6% of our broad measure of global liquidity, in line with the average year-to-date.
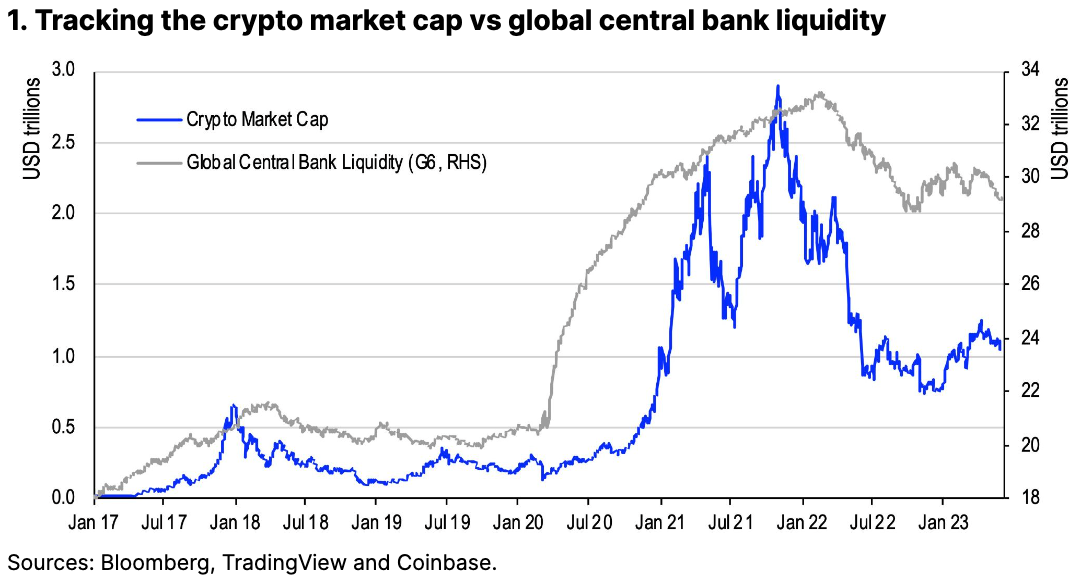
Part of why global liquidity increased in 1Q23 was because of the drawdown in the US Treasury General Account (TGA) balance (which we’ve previously discussed here). That began around end-January after the US government breached its debt ceiling limit – forcing it to rely on the TGA to pay expenses without new debt issuance. That consequently lent support to a broad swathe of assets, crypto included. With a fiscal deal agreed in early June to resolve the debt ceiling, the question now becomes whether we could see market liquidity drained and markets suffer, as the Treasury rebuilds the TGA.
To replenish its standing balance, the government will likely need to issue $700B on top of rolling over its existing debt, bringing the potential liquidity impact to a little over $1T over the next six months. In isolation, we estimate that that could potentially represent net losses of as much as 18-20% for the crypto asset class. However, the market impact ultimately depends on who absorbs the newly issued debt.
If US banks buy these short-dated T-bills, for instance, that would drain bank reserves, reduce liquidity and strengthen the USD - hurting crypto as the price currency. If, on the other hand, money-market funds step in, the flow from their reverse repo facility (RRP) with the Fed to Treasuries would be characterized as liability transfers on the balance sheet that have limited bearing on the USD.
Of course, the reality is that it’s not likely to be an “either-or” situation, and there may be other potential buyers like households and corporate treasuries that could also reduce available market liquidity by pursuing Treasuries in lieu of riskier assets. But through March to May, aggregate bank reserves with the Fed have been stable to higher despite the decline in commercial bank deposits (translating to a higher bank reserve ratio), which earn more than what they can earn in T-bill yields. We think that leaves money market funds as the biggest potential buyer here, which suggests the actual USD impact and thus the impact on cryptocurrency price behavior could be constrained.
Detrending the liquidity effect
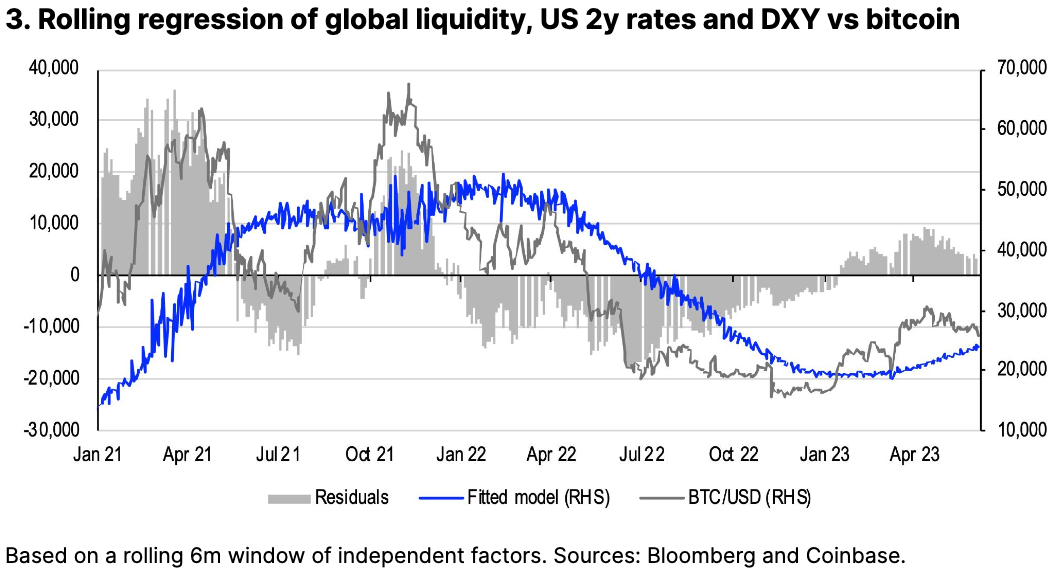
If we remove the influence of global liquidity trends from bitcoin’s price behavior, it reveals a compelling narrative about how bitcoin has performed within different economic regimes. Our multivariate linear regression model is based on a rolling 6-month window, fitted against daily changes in global liquidity, interest rates and the multilateral USD index. We then extract the residual between observed bitcoin spot prices and our model-fitted values to determine if there are any discernible patterns in the “detrended” series.
Factor analysis suggests that bitcoin unsurprisingly underperformed our model last year, with the greatest deviation having occurred in late June – amid solvency concerns for entities like Celsius, Three Arrows Capital (3AC) and Voyager. Bitcoin has since outperformed our model year-to-date, in part reflecting (1) its relative discount to its estimated fitted value as well as (2) improved supply-side technicals and (3) demand for its “store of value” properties as an alternative to the points of failure witnessed in the existing financial system earlier this year. See chart 3.
Looking further back, this exercise is also useful for disentangling the effect of liquidity from bitcoin’s block reward halving events, which have often coincided with major episodes of central bank bond buying. Bitcoin halvings occur about every four years (or more accurately, every 210,000 blocks) as a way to manage the supply of new bitcoins in circulation, notably by halving the block reward. The next halving is expected in April or May 2024 when the block reward will be reduced from 6.25 bitcoins per block to 3.125 bitcoins per block.
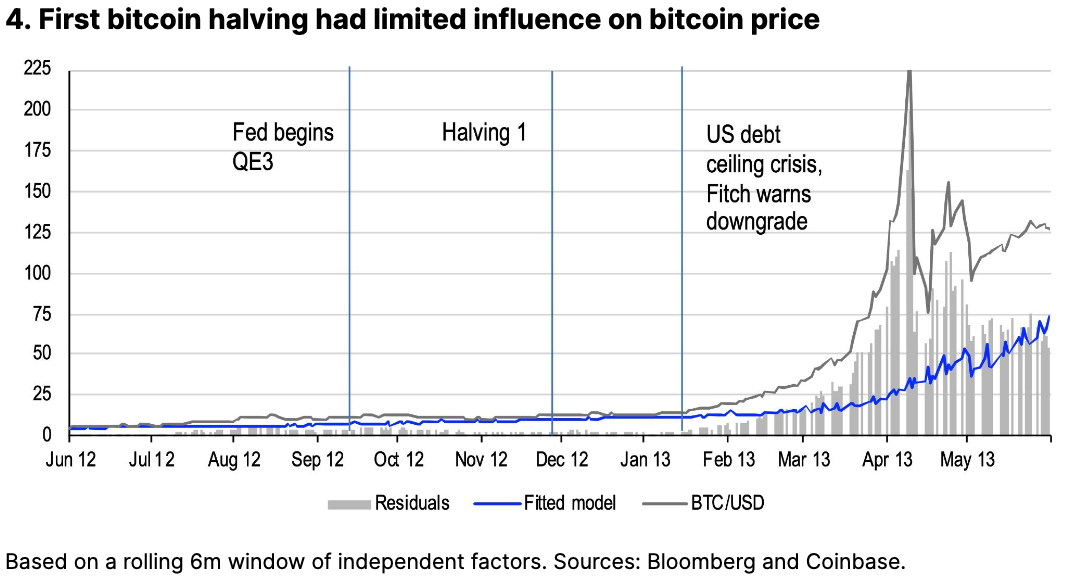
The first bitcoin halving occurred on November 28, 2012, which followed the Fed’s implementation of QE3 (September 2012), the third round of quantitative easing. Unlike previous rounds, QE3 involved the purchase of mortgage backed securities and longer-dated Treasuries. Around the same time (August 2012), the ECB initiated its “Outright Monetary Transactions” program in response to the financial headwinds caused by the European debt crisis, which had been ongoing since late 2009.
If we examine bitcoin behavior six months prior to and six months following the first halving compared to our model, we notice that the impact of that liquidity boost had little effect. But the model residual doesn’t reflect a significant impact from the halving either, which could have been due to (1) the inefficiency of this market back then and/or (2) uncertainty over the halving’s market implications. While bitcoin prices did pick up in late 2012, they only started to appreciate in earnest in early 2013 after the US debt ceiling crisis began in January that year escalating into a budget sequestration in March. At that time, we think bitcoin’s price better reflected its value as a hedge against fiscal uncertainty. See chart 4.
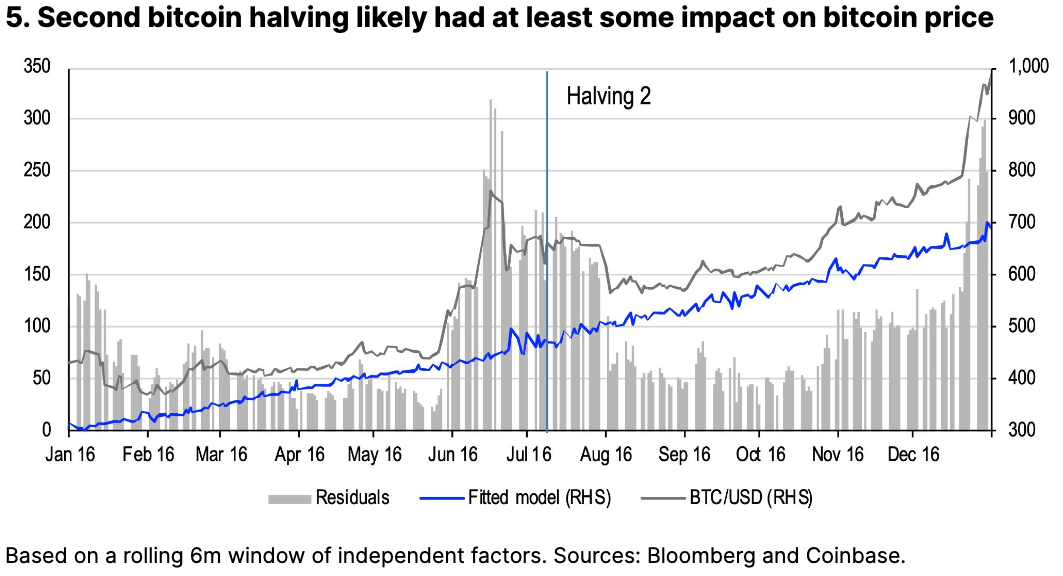
The second bitcoin halving occurred on July 9, 2016, which immediately followed the Brexit referendum (June 23, 2016) that led the Bank of England to resume its bond buying program. While that black swan event itself may not have unlocked significant liquidity, it’s possible that bitcoin prices may have swelled in response to the economic upheaval and volatility that it represented. Brexit also came after the ECB’s decision months earlier to extend the Expanded Asset Purchase Programme (EAPP), which had been initiated in March 2015 and scheduled to end in 2016.
If we remove the effect of liquidity on bitcoin prices, our model residual does still reflect a noticeable increase during the month preceding and following the second bitcoin halving. Note that unlike the first halving, this second halving was both well-telegraphed and highly anticipated, which may have factored into the market reaction. While it’s possible that bitcoin’s fundamentals contributed to its strength at this time due to global events, we think it’s very likely that the halving had some impact on performance by enhancing bitcoin’s prospective scarcity.
The third halving occurred on May 11, 2020 which followed extraordinary measures taken globally among central banks and governments in response to the COVID-19 pandemic. In late March 2020, the Fed began large-scale and open-ended bond purchases (QE Infinity) to support financial market stability, while the US government enacted a fiscal stimulus package known as the CARES Act. At the same time, the ECB bought bonds as part of its Pandemic Emergency Purchase Program (the European Union also introduced the Next Generation EU recovery plan - including a €750 billion recovery fund - but only in July 2020).
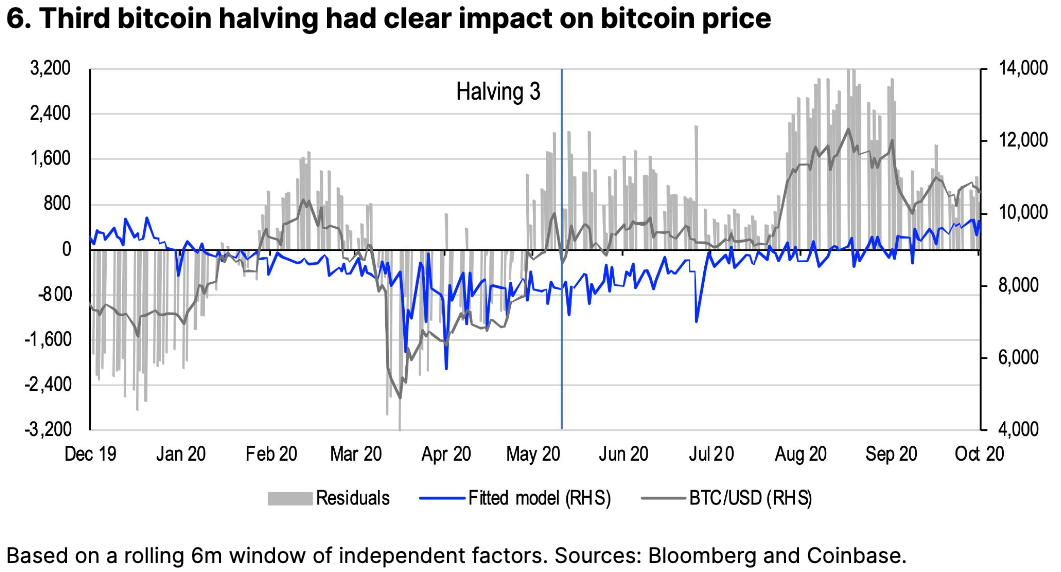
Between March and early May 2020, bitcoin recovered the losses that it had incurred at the onset of the pandemic, converging to the fair value implied by our model. That was reflected in a declining net negative residual, which suggests that the retracement was due almost exclusively to the rise in liquidity at that time. Subsequently, that residual spiked two weeks prior to the third halving, which we believe suggests that this event did have a significant impact on bitcoin’s price action and likely accounts for the difference between the observed vs model value.
Conclusions
We think it’s possible that the next bitcoin halving in 2Q24 could have a positive impact on the token’s performance. However, the limited supporting evidence makes this relationship still somewhat speculative, in our view. With only three halving events historically, we have yet to see a clear pattern fully emerge, particularly as previous events were contaminated by factors like global liquidity measures. Looking ahead, global liquidity appears to have peaked in the near term and there’s still another 9-10 months until the next halving, which ultimately makes it unclear what the net effect on bitcoin’s price behavior might be in the future. That said, we remain committed to our constructive longer-term outlook on the macro picture 6-12 months from now, as we’ve previously discussed.


