Macro: deviations
In September, the market’s soft landing thesis was supplanted by concerns over higher-for-longer interest rates, as long-end US Treasury bond yields approached 5% – their highest in over 16 years. Those yields reflected concerns that the Federal Reserve’s policy stance would need to compensate for the significant procyclical government spending keeping the US economy exceptionally strong. (See our comments in the August 2023 Monthly Outlook.) Since then, the bond market rout has been temporarily relieved by a safe haven bid precipitated by geopolitical tensions in the Middle East.
However, it’s not entirely clear that yields have peaked here, as we believe that supply-demand imbalances in the Treasury market still persist. But for now, the Fed has toned down its hawkish rhetoric due to the sharp tightening in US financial conditions. That suggests the Fed may be done with rate hikes for this cycle, potentially lowering the relevance of the November and December FOMC meetings for market performance in 4Q23.
What’s interesting is that crypto prices have had an inverse relationship with changes in the term structure of the US Treasury yield curve since mid-1Q23 (a departure from its positive correlation in 4Q22). But the strength of that relationship is very different for BTC (vs the US 3m10y slope) compared to ETH (vs the US 3m10y slope). That is, the correlation coefficient in the former is 0.42, signifying a relatively weak linear relationship between bitcoin and the recent steepening in the yield curve. The correlation coefficient in the latter is 0.76, signifying ether currently has a relatively strong relationship with the recent shift. This deviation started to emerge in mid-June, around the time of multiple spot bitcoin exchange traded product (ETP) filings in the US.
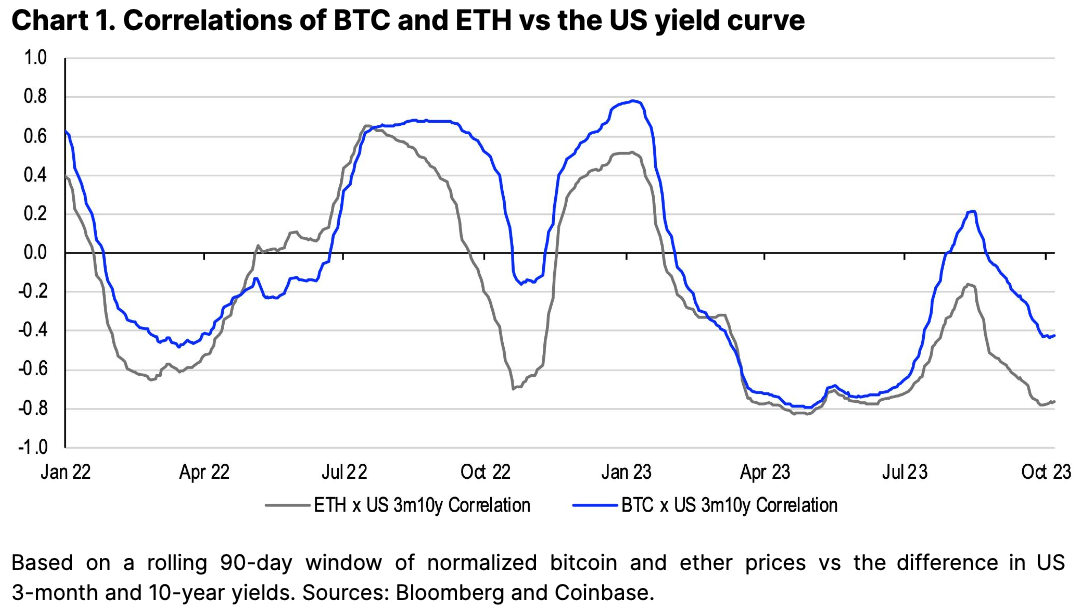
We believe this gap reflects a premium for bitcoin over other digital assets. For example, the ETH/BTC cross has been unable to convincingly breach above the 50-day moving average (currently around 0.06) since mid-June, breaking 5.6% lower in October MTD (as of October 11). In our view, the relative demand imbalance is due to (1) a lack of bitcoin selling pressure ahead of some key (approaching) deadlines for spot bitcoin ETP applications, (2) bitcoin’s flight to quality status within the asset class and (3) a lack of other crypto specific narratives vying for market participants’ attentions.
ETFs: Sit and watch
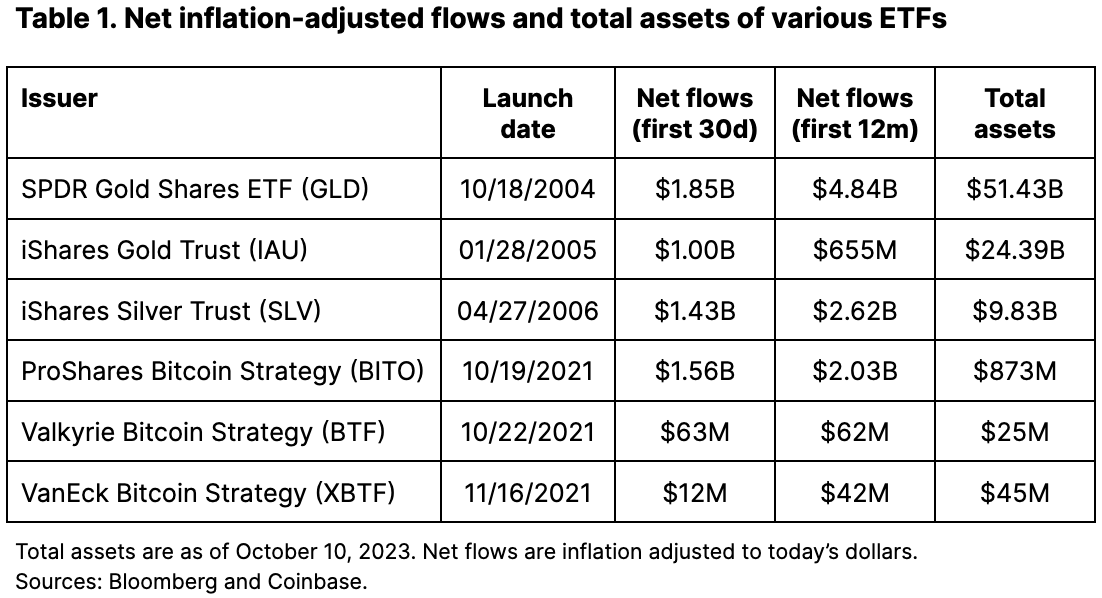
Ultimately, we think the divergence in the performance of bitcoin and other tokens shows that the potential approval of one or more spot bitcoin ETPs has already been partially priced in. That makes it less clear how much more bitcoin could outperform if a favorable US Securities and Exchange Commission (SEC) decision occurs. That is, in the event of one or more approvals, we believe there could be meaningful net inflows, but these may take time to materialize while markets tend to be impatient.
For example, the SPDR Gold Shares ETF (GLD) was a pioneer in the US gold exchange traded products market when it launched on November 18, 2004, almost 19 years ago. In hindsight, GLD has been a widely successful financial product with total assets of $51.4B today, according to Bloomberg. However, if we look at its metrics, GLD attracted only US$1.9B in net inflows (inflation adjusted to today’s dollars) within the first 30 days of launch and only grew that to $4.8B within the first 12 months of its life. See table 1 for comparable statistics on other precious metal ETFs alongside some bitcoin futures-linked ETFs.
That said, the impact of one or more spot bitcoin ETP approvals is not measured in flows alone. We believe many market players may interpret potential approvals as a tacit shift in the US regulatory environment, which could support bitcoin prices specifically and crypto prices more broadly. However, that dynamic is much less tangible or measurable than flows and thus harder to price.
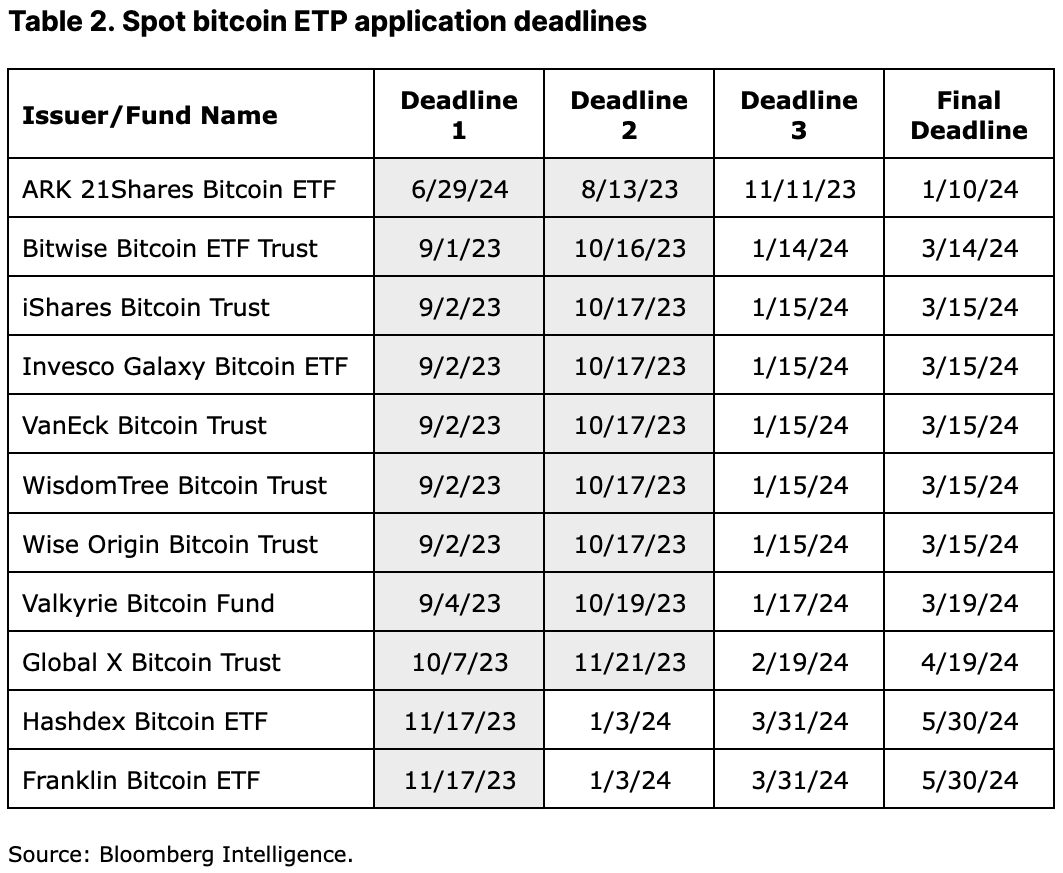
Meanwhile, the timing of the SEC’s spot bitcoin ETP decisions is complicated by gridlock in the US House of Representatives over federal funding, which could trigger a government shutdown on November 17 – potentially leading up to 90% of SEC staff to be furloughed. Already, the SEC has deferred its decision on multiple spot bitcoin ETP filings, with a couple now having a second deadline of January 3, 2024 and the majority having a third deadline of January 15, 2024.
However, we believe it’s important that the ARK-21Shares Bitcoin ETF application has a final deadline for SEC review of January 10, 2024. That is, we believe that barring a US government shutdown, it’s entirely possible that we may see the SEC make a decision before the end of 4Q23. Otherwise, that puts the SEC in the awkward position of possibly deferring its decision on a subset of filings on January 3, 2024, right after the holidays, only to address a final deadline decision for one ETF filing days later on January 10. To avoid sending mixed messages, we think the SEC could decide to collectively address these applications in December 2023.
Liquidity
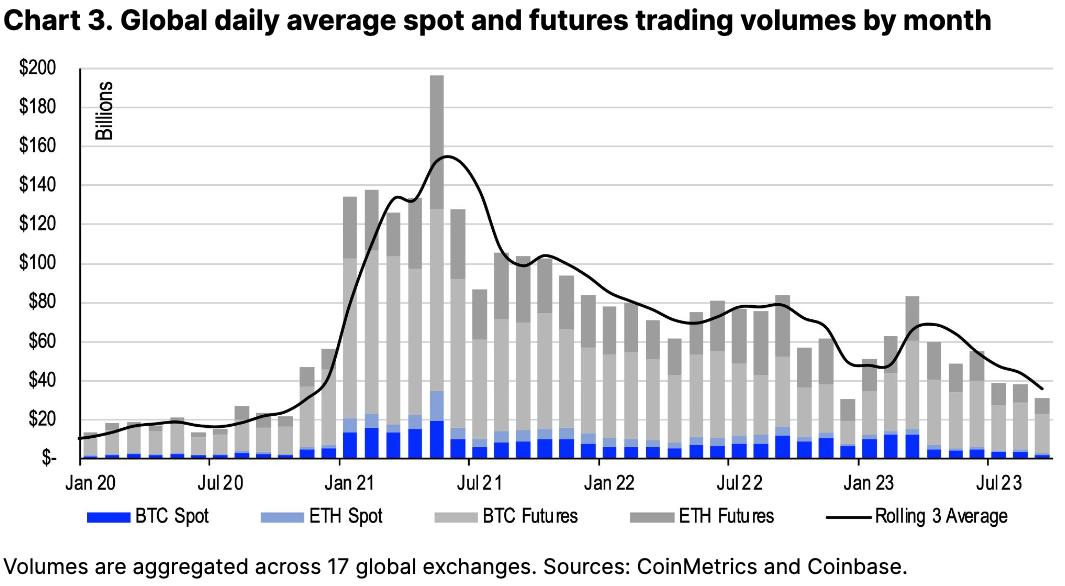
Aggregate average daily spot and futures (including both perpetual and traditional futures) trading volumes for BTC and ETH across global centralized exchanges declined further in September to $30.9B from $38.2B in August, based on CoinMetrics data. Trading activity for these large-cap tokens is now comparable to the levels observed in December 2022, and prior to that, late 2020. Note that liquidity has been constrained for both traditional and crypto markets, as central banks have continued to unwind their balance sheets. On the upside, stablecoin dominance has been ticking higher in the first two weeks of October, rising to 12%, which may be a positive technical factor for digital assets in the near term.
Also, despite the decline in volumes over the last three months, we have not seen a major reduction in overall market depth, which looks comparable to the levels observed in early 2Q23. For example, if we look at the total number of bid vs ask orders within 0.1%, 1% and 2% of their respective mid prices for BTC/USD on Coinbase’s order book, markets have not appeared to be any shallower in recent months while spreads appear to be stable, based on publicly available data from CoinMetrics. Although that may suggest some increased market concentration, we think the data indicates that price formation in the market is still happening in an efficient and reliable way.