What is an order book?
Part one of our guide to Advanced Trading, tools and features to help you take greater control of your portfolio.
Definition
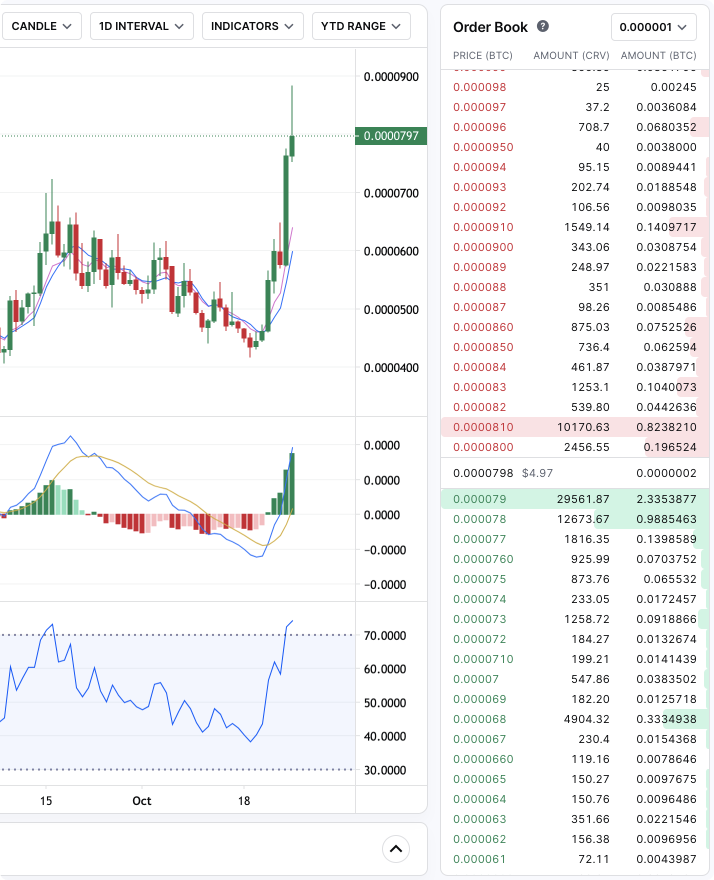
An order book, essentially, is a list of current buy orders (also known as “bids”) and sell orders (also known as “asks”) for a specific asset. Order books show not only the price buyers and sellers are willing to pay, but also how many discrete units (as in tokens) they seek to buy or sell at each price.
For every cryptocurrency available on Coinbase (and every financial instrument available via, say, Nasdaq) there’s an order book. Because Coinbase is a big exchange with lots of customers, there can be millions of people looking to buy or sell at any given time. Looking at the order books for the cryptocurrencies you’re interested in is one of the best ways to get a sense of the real-time fluctuations in supply and demand.
An order book, essentially, is a list of current buy orders (also known as “bids”) and sell orders (also known as “asks”) for a specific asset. A generation ago — before crypto even existed — order books were actual physical books maintained by exchanges. Today order books are electronic, accessible on computer screens anywhere in the world, and are dynamic, meaning they are constantly updating.
Order books show not only the price buyers and sellers are willing to pay, but also how many discrete units (as in shares or tokens) they seek to buy or sell at each price. Exchanges don’t actually possess the assets that are being traded — instead they function as a matchmaking service, pairing interested buyers and sellers together.
Coinbase is currently rolling out a suite of Advanced Trading tools, so in this series we’re breaking down some of the functions and terminology you’ll encounter. Much of this information isn’t specific to Coinbase or even crypto, making it useful to learn if you have any interest in markets and trading. We also have a new video series that covers this material in more detail and illustrates exactly how these new tools, charts, and features work if you’re using the Coinbase app or Coinbase.com.
Most order books are divided into halves on a screen. In the advanced trading view on Coinbase.com, the order book is separated vertically, with the asks and bids scrolling toward the middle. On the Coinbase, it’s separated vertically, with asks in red on the top and bids in green on the bottom.

Buy orders (or bids) are represented by green numbers scrolling down towards the middle. These are people trying to buy.
Sell orders (or asks) are red numbers moving up from the bottom. These are people trying to sell.
The number in the middle is called the spread — it’s the difference between the highest bid and the lowest ask.
The price chart displays recent prices, customizable to a timeframe between one minute and one day. (Learn more about reading charts in part three of this series.)
The depth chart is a visual representation of the order book — it depicts the number of open orders over a range of prices (more on this below).
On the right of the screen is a constantly updating trade history across all market participants.
Key terms
Let’s get familiar with some of the terminology people use when talking about or interacting with order books.
Top of the book: Where the current lowest asks and highest bids are located — these are typically the first orders that will be filled.
The spread: The difference between the highest bid (best bid) and the lowest ask (best ask).
Price: This is simply the amount a buyer or seller is aiming for. The first trades that will execute are the highest bids and the lowest asks.
Market order: You can use a market order if you just want to buy or sell right away at the best available price.
Slippage: Slippage happens when there isn’t enough of an asset available at the current price to completely fill a market order. As a buyer, this can result in part of your order being filled at a higher price.
Limit orders: Limit orders allow you to manually select the maximum price for your buy order and minimum price for your sell order — it will execute only if that price is hit (which means there’s no guarantee your trade will be executed). As a buyer, you might want to use a limit order if you believe the market is moving lower. One important thing to remember: all the prices you see in the order book all represent limit orders, because market orders get filled right away. Read more about order types in part two of this series.
The amount: This number refers to how many units of an asset buyers seek to buy (or sellers seek to sell) at a specific price. If, for example, ten investors are looking to buy two BTC each at no more than $37,000, the count would be 10 (the number of buyers) and the amount would be 20 (the number of Bitcoin sought at $37,000). Most order books will not expose the count of traders buying or selling at a specific price.
Got it? Here’s how it works in practice:
Start by imagining a hypothetical high-rolling trader who places a market order — an order at the best available current price — for 30 BTC.
If the top of the book shows a seller with ten BTC priced at $66,500, the first ten BTC of the order will be executed at that price.
Once those ten BTC are no longer available, the seller with the second-lowest ask will move to the top of the book. If that seller has 100 BTC available at $66,775, the remaining 20 BTC will be fulfilled from this pool.
So in the end, the buyer will have paid $2,000,500.00 for 30 BTC (plus fees). Once 80 more market orders are fulfilled at $66,775, the next lowest ask will move to the top of the book.
As this example illustrates, it’s easy to see how demand for an asset can quickly drive the price skyward. An absence of buyers will have the opposite effect on the order book, driving the price downward.
What is a depth chart?
A depth chart is a visual representation of the information in the order book. Learning to read depth charts is a useful skill, because they’re an excellent tool for getting a quick sense of what’s happening in a market. When people talk about “depth,” they’re referring to the supply of an asset — the total amount available to buy and sell at each price point. In general, the more buy and sell limit orders there are for a given asset across prices, the “deeper” the market is considered to be.
You can think of the depth chart as the order book, but flipped on its side. On the x-axis, you’ll see price points, increasing from left to right. On the y-axis, you'll find the total amount of, say, bitcoin available to buy or sell, increasing from bottom to top.
Just like the order book, the depth chart has a buy side and sell side. The green bid line shows the total value of the bids, or buy orders. And the red ask line shows the total value of the asks, or sell orders. In the middle, you’ll see the current mid-market price, along with the spread — the gap between the highest bid and lowest ask.
Experienced traders look for familiar patterns in these charts, and use them to make educated guesses about where the market might move next. For example, steep cliff-like patterns are known as walls. On the buy side, they’re called buy walls, and on the sell side, they’re called sell walls.
Walls can indicate that a lot of people want to buy or sell at a specific price, and they can act like literal barriers to price movement. Buy walls can mean that an asset has support at a given price — a very large buy order, for example, or lots of people looking to buy can keep prices from going down. And sell walls can show resistance at that price — a large sell order or lots of people looking to sell could block prices from going up.
Like any chart or indicator, the depth chart provides one of many perspectives for analyzing crypto markets, forming an opinion on where prices are headed next, and deciding the price of your next trade.
Disclosure
Coinbase offers simple and advanced trading. Advanced trading is for experienced traders and is subject to the Trading Rules. Fees on the two platforms vary. Content is for informational purposes and is not investment advice. Investing in crypto comes with risk.


