Introduction
How applications access blockchain data is almost as important as the technology underlying blockchains themselves. The ever expanding information sitting on blockchains offer limited benefits if we can’t easily find the data we need to conduct analysis or run smart contracts. With that in mind, we believe The Graph (GRT) could play a critical role in the crypto infrastructure needed to build web 3.0.
The Graph is a protocol which facilitates data searches on blockchains, much in the same way search engines like Google index web pages to help users find what they need on the internet quickly. GRT is a utility token that powers this protocol and facilitates the economic incentives that allow interested parties (consumers, indexers, curators and delegators) to make this system work in a decentralized way. Thus, users can rely on The Graph instead of private node providers to query and retrieve blockchain data.
However, The Graph’s fundamentals are somewhat tricky. For example, measuring GRT supply is not strictly about issuance vs burn rates, but other considerations include how many tokens are being staked or delegated as well as the GRT being unlocked based on a preset release schedule. We estimate that an additional GRT1.5B could be added into circulation over the next six months, but the overall impact on volatility could be limited by the economic interests of the entities entitled to those tokens.
In this report, we examine the microeconomic interactions among The Graph’s network participants that affect the issuance and circulation of GRT in relation to its overall valuation.
Background
To oversimplify what The Graph does (for the sake of brevity), it essentially serves two main functions: (1) index (classify) blockchain data and (2) supply users with access to those indices. Users and dapps can then easily query data on blockchains like Ethereum, Filecoin (IPFS) and POA. [1] What’s interesting is how The Graph accomplishes this.
The main innovation offered by The Graph is that it achieves the functions above in a decentralized way. It does this by creating economic incentives among several interested parties to work together and provide services to consumers. Alternatively, users can rely on blockchain node providers (like Infura, Alchemy and GetBlock) which may host their own centralized databases to carry the data that developers may need. However, applications using such private services may have trouble being categorized as fully decentralized under a web 3.0 framework (which we describe as a user-controlled internet.)
How it works
There are four key elements to The Graph’s economic workflow.
Curators stake (deposit) GRT to flag what content on a blockchain might be worthwhile to index (grouped into open APIs called subgraphs). They earn 10% of the GRT query fees that consumers pay to access their subgraphs, in proportion to the size of the stake on a particular subgraph.
Indexers operate the nodes that actually (1) index the blockchain data (for which they receive GRT index rewards) and (2) provide query processing services to consumers (for which they set prices per query and receive GRT query fees.) They need to stake GRT to join and receive work from the protocol.
Delegators do not operate nodes but can earn a share of the GRT index rewards and query fees by delegating their GRT with specific indexers of their choosing, enabling competition among indexers.
Consumers are the end users paying GRT query fees to indexers, curators and delegators in order to access and retrieve subgraph data on a given blockchain using the GraphQL programming language.
Monetary policy
As you can infer from the workflow, participation in the network may require (at least theoretically) GRT purchases while earning GRT requires some form of staking. [2] A percentage of staked tokens can be ��“slashed” as a penalty against indexers for failing to provide high quality services (around 2.5% of staked GRT have been slashed thus far.) There is also a deposit tax on curators and delegators that penalizes poor decision making that could harm the protocol.
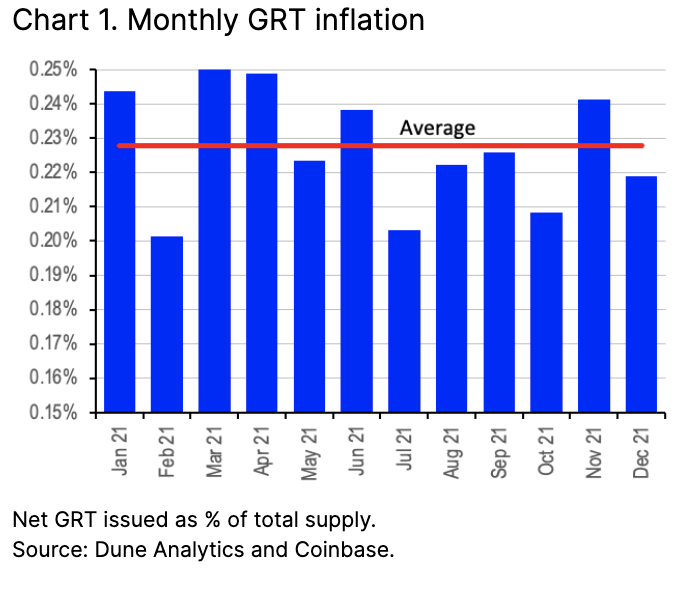
New issuance of GRT comes in the form of the index rewards paid to indexers, which is programmatically targeted to raise total GRT supply by 3% annually (in the first year.) However, functionally the inflation number (i.e. the net change in token supply) was closer to around 2.7% in 2021 (see chart 1 for monthly figures) as this tends to fluctuate with the amount of GRT staked within the community, among other things. [3] The target inflation level is reviewed periodically via independent technical governance and can even be reduced to 0% though the protocol states that a target in the low single digits is most likely.
Note that the amount of GRT burned last year had very little bearing on overall inflation. Total GRT burned includes around 1% of query fees, 100% of deposit taxes and part of the curation fees incurred by curators when they signal a subgraph. We measured the annual burn rate at only 0.14% of the total potential supply in 2021 (after we added back burned tokens plus the hypothetical index rewards earned on those tokens).
There is no cap on the maximum GRT supply.
Circulating supply and lock-ups
But monetary policy mainly considers total GRT supply (c.GRT10.3B) which is not all tradeable, where investors should probably focus on the total GRT in circulation (c.GRT5.3B). Circulating supply is affected by the lockup periods for specific GRT owners. Total GRT supply in circulation grew 3.3x in 2021 for example due in part to the tokens added between June and July.
Table 1 shows the initial allocation of the total GRT10B tokens minted at launch. After the first unlock for several ownership entities in December 2020, there was a circulating supply of around GRT1.3B sourced mainly from a GRT400M public sale plus GRT460M attributed to the Graph Foundation to support dapp developers and finance grants.
Table 2 shows that the end of the lockup periods for two groups – (1) the early team (i.e. the founders, employees and contractors) and advisors as well as (2) early backers – added around GRT3.7B tokens to the total circulating supply in mid-2021.
In the next six months, we estimate another GRT1.5B tokens to be added to the circulating supply (including new issuance) mainly from later stage backers but also to a lesser extent testnet indexers and holders from the strategic GRT sale. That could take the total GRT in circulation to c.GRT6.8B.
That said, we saw only modest additional volume transacted on exchanges immediately after the major unlocks last year, which suggests the majority of additional token supply was not sold in the open market, at least not in significant size (chart 3.) In our view, that likely speaks to the investment sentiment of the two key ownership entities involved in that specific unlock.
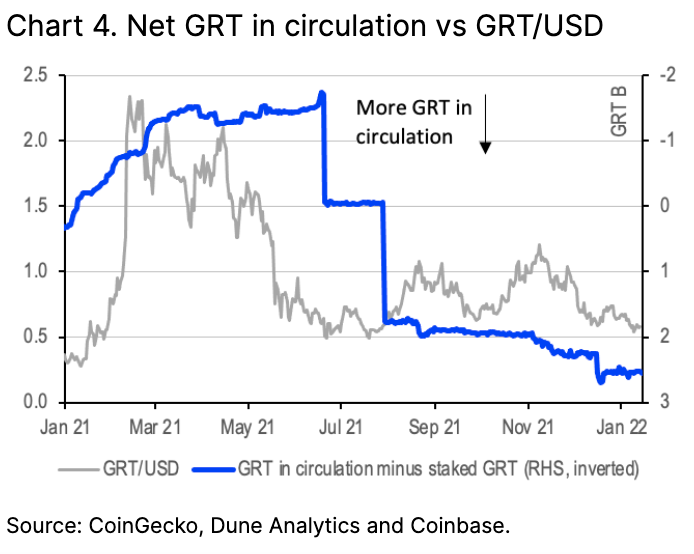
Regardless, poor GRT performance seemed to anticipate the increase in circulating supply by around three months, though it’s hard to disentangle that weakness from the overall market sentiment that drove crypto prices lower in late 2Q21. In chart 4, we look at the performance of GRT/USD relative to the GRT in circulation (minus any staked or delegated GRT) which reverted to positive territory in late July 2021. Since early November 2021, this net circulating supply measure has tended to lead rather than lag GRT performance, with GRT/USD moving inside a tight range through 4Q21.
Looking ahead, we would not expect the GRT being unlocked by later stage backers (the bulk of the upcoming GRT1.5B in additional circulating supply) to be offloaded en masse onto the market in 1H22. While there could be some downside pressure on GRT due to supply dilution, we think the overall market impact could be fairly limited given the precedent we saw in June to July 2021. There is also a smaller GRT200M that was sold to indexers and strategic community members, which was unlocked in December 2021. But unlike the GRT400M sold to retail investors in December 2020, we think this group could delegate some portion of its tokens to the network based on their role within the GRT community, rather than selling most or all of their allocation on exchanges.
Conclusions
Ultimately, we think there are two key factors that could drive the supply-side dynamics of GRT longer term, in addition to the monetary policy we discussed above. The first is the maintenance of incentives for the economic actors involved in the network which is directly linked to the reaction function of the ownership entities whose tokens will be unlocked over the next few years. The second is the network’s economic growth in terms of how quickly The Graph will expand to indexing subgraphs on additional blockchains. This could increase the portion of the GRT supply being staked or delegated, reducing the net circulating supply on exchanges.
Indeed, we are still seeing the early stages of this project, so while it’s hard to quantify the prospects for economic growth, we believe it’s on the higher end of the spectrum. In this respect, The Graph’s governance will be important to watch alongside its fiscal policy. Mainly, we would observe how The Graph Council distributes grants to developers (via The Graph Foundation) and approaches ecosystem funding and protocol upgrades.