Introduction
Crypto markets are still in the midst of a cyclical downturn, something we’ve been discussing as early as November 2021. After a massive liquidity injection at the start of the pandemic, the growth of global central bank balance sheets has been moderating for some time (even if the absolute level is still at historical highs and the impulse remains positive.) In our view, the net change is what tends to impact the performance of higher beta risk assets, which is why the prospect of shrinking liquidity has created massive headwinds for cryptocurrencies.
On the other hand, the inflow of liquidity into crypto markets over the last two years has contributed to its development in ways that may now limit the worst of the downside volatility that characterized the crypto winter of 2018. At that time, financial conditions led total crypto market capitalization to decline by 75% through early 2019 and volumes didn’t pick up convincingly until 2H20.
Timing the end of the current selloff remains a challenge, as the speed of the U.S. Federal Reserve’s recent policy transition will continue to have a major impact on high risk assets. But we have also seen major improvements in cryptocurrencies with regards to price discovery and market making as a direct result of the liquidity inflow over the last two years, which raises efficiency and lowers volatility.
Moreover, the growth of stablecoin volumes coupled with the wider adoption of smart contact platforms and improvements in underlying blockchain technology all set a foundation for this asset class to better weather market stress in the future.
Wither crypto winter?
Market concerns over the Fed’s quantitative tightening (QT) plans have been an important driver for the recent crypto volatility in 2022 year-to-date. Recall that in early 2018, tightening global liquidity conditions preceded “crypto winter” alongside extended bitcoin spot positioning after BTC futures were listed on the CME exchange for the first time.
Between early 2017 and early 2018, the ratio between the outstanding crypto market capitalization (ex-stablecoins) and the total size of major global central bank balance sheets rose from a negligible 0.1% to 2.8% of total liquidity. [1] Chart 1 shows that global central bank balance sheets rose by US$2.85T in 2017 and continued to rise until March 2018 (to $3.55T) albeit at a slower pace, before quantitative tightening pared this back by around US$1.4T through mid-2019.
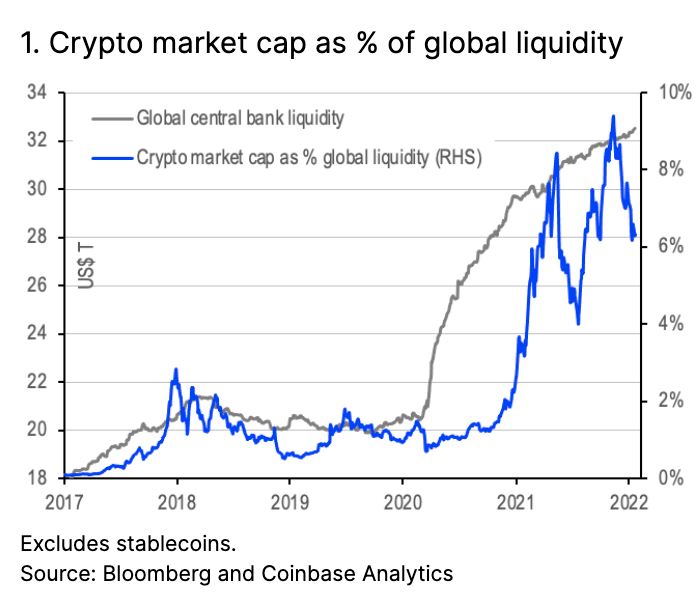
Comparatively, central bank liquidity injections over the last two years have totaled more than triple the amount we saw in 2017-2018 at almost $12T. As a result, we have seen the crypto market expand relative to the size of global balance sheets from 0.9% at the start of 2020 to 9.4% in late November 2021. (Note that the bulk of that expansion happened only after credit spreads on U.S. bonds had tightened to their equilibrium lows in late 2020 – see chart 2.) This suggests that global balance sheet growth has had a distinct impact on crypto from both a trading and valuation standpoint. Steadily, this metric has come down to 6.3% as of January 20, 2022.
But we want change
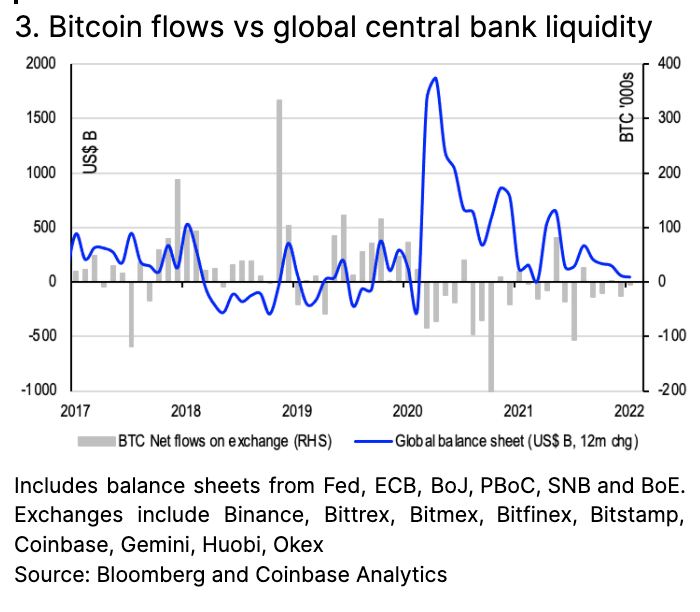
One reason why crypto prices have been so unstable in the last few months is that the absolute levels of global central bank liquidity tend to be less relevant for performance than the net change in liquidity. Chart 2 shows that over the last five years, there has been a direct relationship between monthly changes in the size of global central bank balance sheets (falling for the last three quarters) and net crypto flows on centralized exchanges based on on-chain data. That is, trading activity on centralized exchanges appears to be sensitive to the rise and fall of global central bank balance sheets, in our view.
This is why understanding the speed of the eventual global balance sheet reduction is so important, as market players assess whether high and sticky inflation could force central banks to actively sell assets rather than simply let them runoff. In our view, it’s important not to underestimate the aggressiveness of the policy transition we are seeing and the subsequent impact that this could have on risk asset performance.
What we heard from the Fed on January 26 is that authorities still intend to allow their bond holdings to mature (and not reinvest the proceeds), rather than selling to quickly shrink the size of their balance sheet. We think it may take several meetings before the Fed makes a final decision on QT, though market expectations are that this could begin in July or August at a pace of around $30-40B per month. Note that we previously mentioned that the Fed has around $1.6T in excess cash on its balance sheet related to reverse repos that may act as a buffer when it does start to shrink liquidity.
Better buffers
As global liquidity recedes and the net change in total balance sheet size falls into negative territory, it’s no surprise that crypto markets have depreciated. Quantitative easing has been an important catalyst for cryptocurrency adoption as market players went further out on the risk curve over the course of 2020 in search for higher yields while credit spreads on corporate bonds sharply tightened.
Mitigating circumstances
Thus, we think cryptocurrencies are less likely to face the same downside volatility that characterized the crypto winter of 2018, in terms of being either a shorter or shallower cycle (possibly both.) Note that this is not necessarily a statement on the growth of institutional adoption nor their (un)willingness to sell holdings in times of stress. Rather it is a statement on how better liquidity has helped refine price discovery and market making in this space in a way that wasn’t available four years ago.
For example, growth in the stablecoin market – supported by the injection of global central bank liquidity over the last two years – now provides an important liquidity buffer in the crypto market during risk off periods. Stablecoins help keep funds within the cryptocurrency ecosystem instead of being withdrawn from exchanges.
Just over the course of 2021, the net balance of stablecoins on centralized exchanges has increased almost 3.5x adding $12.2B to these platforms last year. Chart 4 shows that after a net reduction in stablecoin balances in September and October 2021, we saw a net inflow of around $3.5B between November 2021 and January 2022 as market volatility picked up. Overall, the market value of stablecoins has increased from $1.4B (or 0.1% of global central bank balance sheet size) at the start of 2018 to $153B (or 4.7% of global central bank sheet size) as of January 20.
At the moment, stablecoins on centralized exchanges still only represent a tenth of the total stablecoin market supply, consistent with their size relative to the total crypto market cap. As this sector continues to grow, we believe trading activity on crypto exchanges should become less volatile as more money remains inside the system.
Coupling these dynamics with the wider adoption of smart contact platforms and improvements in underlying blockchain technology, we believe this sets a foundation for the crypto asset class to better weather market stress in the future. Smart contract platforms representing either lower cost or higher yielding financial services (as one example) now populates the crypto economy with identifiable use cases. These generate revenue for investors and encourage development in a way that makes projects less sensitive to fluctuations in market price.
Conclusion
The current sell off in cryptocurrencies remains sensitive to the pace with which global balance sheet reduction is happening, even if real rates are still negative for many economies. In the U.S., the Fed has affirmed that it is taking a passive approach to its quantitative tightening, but the runoff will still happen sooner than the timeline we saw back in 2018.
However, despite the uncertain macro environment, we believe the increase in global liquidity over the last two years has reinforced certain structural dynamics of the cryptocurrency market that can now help limit downside volatility. Stablecoins have become a critical part of this asset class, for example, keeping the flow of funds contained within the crypto economy. This can support trading volumes during periods of market stress and facilitate more orderly two-way flows.
Thus, we believe that with market positioning now looking much cleaner in light of the de-risking we have seen in recent weeks (as evidenced by negative funding rates on perpetual swaps and basis in negative territory) we would not expect crypto prices to face the same down cycle - either in terms of duration, depth or possibly both - that we saw during the crypto winter of 2018.